TTM (Trailing Twelve Months) Explained: What It Is & How It Is Used

Joe Michalowski
Director of Content
Most mature and large public companies hit a rhythm of predictability with their total revenue, profit, and budgeting needs to where they can follow a fiscal calendar or annual cycle to discuss key initiatives that will continue to preserve and drive growth.
But many early-stage companies need to engage in the budgeting process and keep a close eye on important metrics in smaller time frames, such as quarterly or monthly. Even then, forecasts can still expand out to 12, 18, or 24 months to see how present-day decisions made around SaaS pricing strategy or headcount planning will impact the future.
More companies are breaking away from the traditional calendar and workflows to create new timelines — but one way to maintain some stability is to run analyses with a trailing twelve-month (TTM) lens.
Table of Contents
What Is TTM (Trailing Twelve Months) in Finance?
TTM is a way for mature (often public) companies to report on financial performance outside of the typical structure of the fiscal year. While the most common use cases for TTM perspectives are in public markets, smaller private companies can also benefit from this view of performance data.
TTM allows for flexibility to get updated information and account for time-specific impacts on the company’s finances. Being able to measure TTM data at any point and account for 12 consecutive months’ worth of financial data means that finance teams can measure recent performance data to quickly get at the “why” behind the numbers. And measuring data from a TTM perspective can better equip finance teams and company leaders for fast-acting insights and decisions during unusually volatile time periods or seasonality.
The CFO’s Path to a Strategic Seat at the Table
TTM Calculation
The TTM calculation depends on the metric. However, TTM is generally calculated one of two ways:
- By adding up figures from the previous 12 months (or four quarters) as a sum.
- By using the most recent year-to-date period, plus the last complete fiscal year, minus last year’s year-to-date period.
Why You Should Analyze TTM Data
TTM offers valuable insights about growth, while accounting for trends and seasonality. As a time frame, TTM accounts for historical data to ensure any patterns of insights can be applied to current-day and future decision-making across the organization.
Mature and public companies use TTM to report on the company’s financial performance outside the restraints of the fiscal year. When releasing quarterly financial reports to stakeholders, they’ll often include TTM figures to show current annualized numbers. These annualized numbers allow for another perspective around the company’s performance path without the influence of inconsistencies, which gives investors and stakeholders a closer, updated gauge of the company’s valuation and potential for future success. TTM can also apply to calculating financial ratios, especially around stock valuation and earnings-per-share, which stakeholders have special interest in as these can be affected by seasonality or the overall economic environment.
For high-growth companies experiencing rapid changes, or even companies experiencing unexpected hypergrowth, looking at TTM offers a rolling view of performance to better understand and anticipate forecasts and trends moving forward. And for early or mid-stage companies, you can apply TTM to metrics as they relate to any type of forecasting and future planning.
The 5 Best Metrics to Analyze TTM
For public companies, you’ll typically see analysis of TTM metrics like TTM revenue, TTM yield, and TTM price/earnings (P/E) ratio. All of these give valuable information about a company’s performance, value, and stock pricing to shareholders. But even if the business isn’t at the point of tracking things like yield or the P/E ratio, there are other cases where TTM figures are valuable both internally and for investors. Startups and early-stage businesses can take a TTM view of the following metrics to dive deeper into the “why” behind the numbers and fully illustrate the company’s financial narrative.
Get The SaaS Metrics Cheat Sheet
1. ARR and MRR
Reviewing your annual recurring revenue (ARR) and monthly recurring revenue (MRR) on a TTM basis allows you to gain a deeper understanding of what your revenue looks like month after month. You can better anticipate recurring revenue growth predictability, identify the best times to reinvest in the company, and track product/market fit over time. One plus of tracking TTM revenue is that you can identify inconsistencies, spikes, and lulls to flag for department leaders and create forecasts with more accuracy.
2. Net Burn Rate
Analyzing net burn rate on a TTM basis helps you see patterns in how quickly the business uses up money. Net burn rate is essential for your cash runway calculations, so looking at it through a TTM view, and ideally on a rolling basis, is a successful strategy for tracking net income and spend. The historical view that TTM provides also allows you to flag and then proactively address any unnecessary spend while identifying areas of opportunity where marketing and sales can prioritize revenue streams and optimize their operational efficiency.
3. Net Revenue Retention
Taking a TTM view of net revenue retention (NRR) helps track the rate at which you’re retaining revenue to track and forecast growth. Since looking at NRR on a TTM basis allows you to check the latest data against historical data, you’ll get a more accurate view of the stability of the business. And you can alert the customer service team regarding any trends in NRR so they can dive deeper into customer satisfaction with the product and optimize retention opportunities. Engineers and product teams may also be curious around how timing product features may impact retention as well.
4. Pipeline
Tracking the company’s sales pipeline metrics, like customer acquisition cost (CAC), CAC payback period, LTV/CAC ratio, average sales cycle, and weighted pipeline revenue helps you predict revenue and profitability more accurately in the future. Tracking pipeline metrics on a TTM basis also helps you address issues within the pipeline quickly and proactively with the sales team, who will further define their pipeline goals and collaborate with the marketing team on how to further pipeline initiatives.
5. Free Cash Flow
Keeping track of your free cash flow on a TTM basis helps you measure the company’s stability and value over time. Investors want to see these numbers on your cash flow statements to get a feel for the financial health of the business. Internally, this metric tells you whether or how much you can reinvest in the business to drive growth while maintaining value with your shareholders. While you may only report on this metric annually, a TTM view better supports strategic decision-making for stronger financial planning.
TTM Example
Sourcegraph, a startup that builds universal code search for developers and companies to support faster innovation, has used TTM to help analyze cash flow and expenses since fundraising $50M at their Series C. The finance team needed visibility into departmental and category spend, as well needing to see cash inflow and outflow to understand how it impacted their burn. They needed to analyze their SaaS P&L statement for the full story.
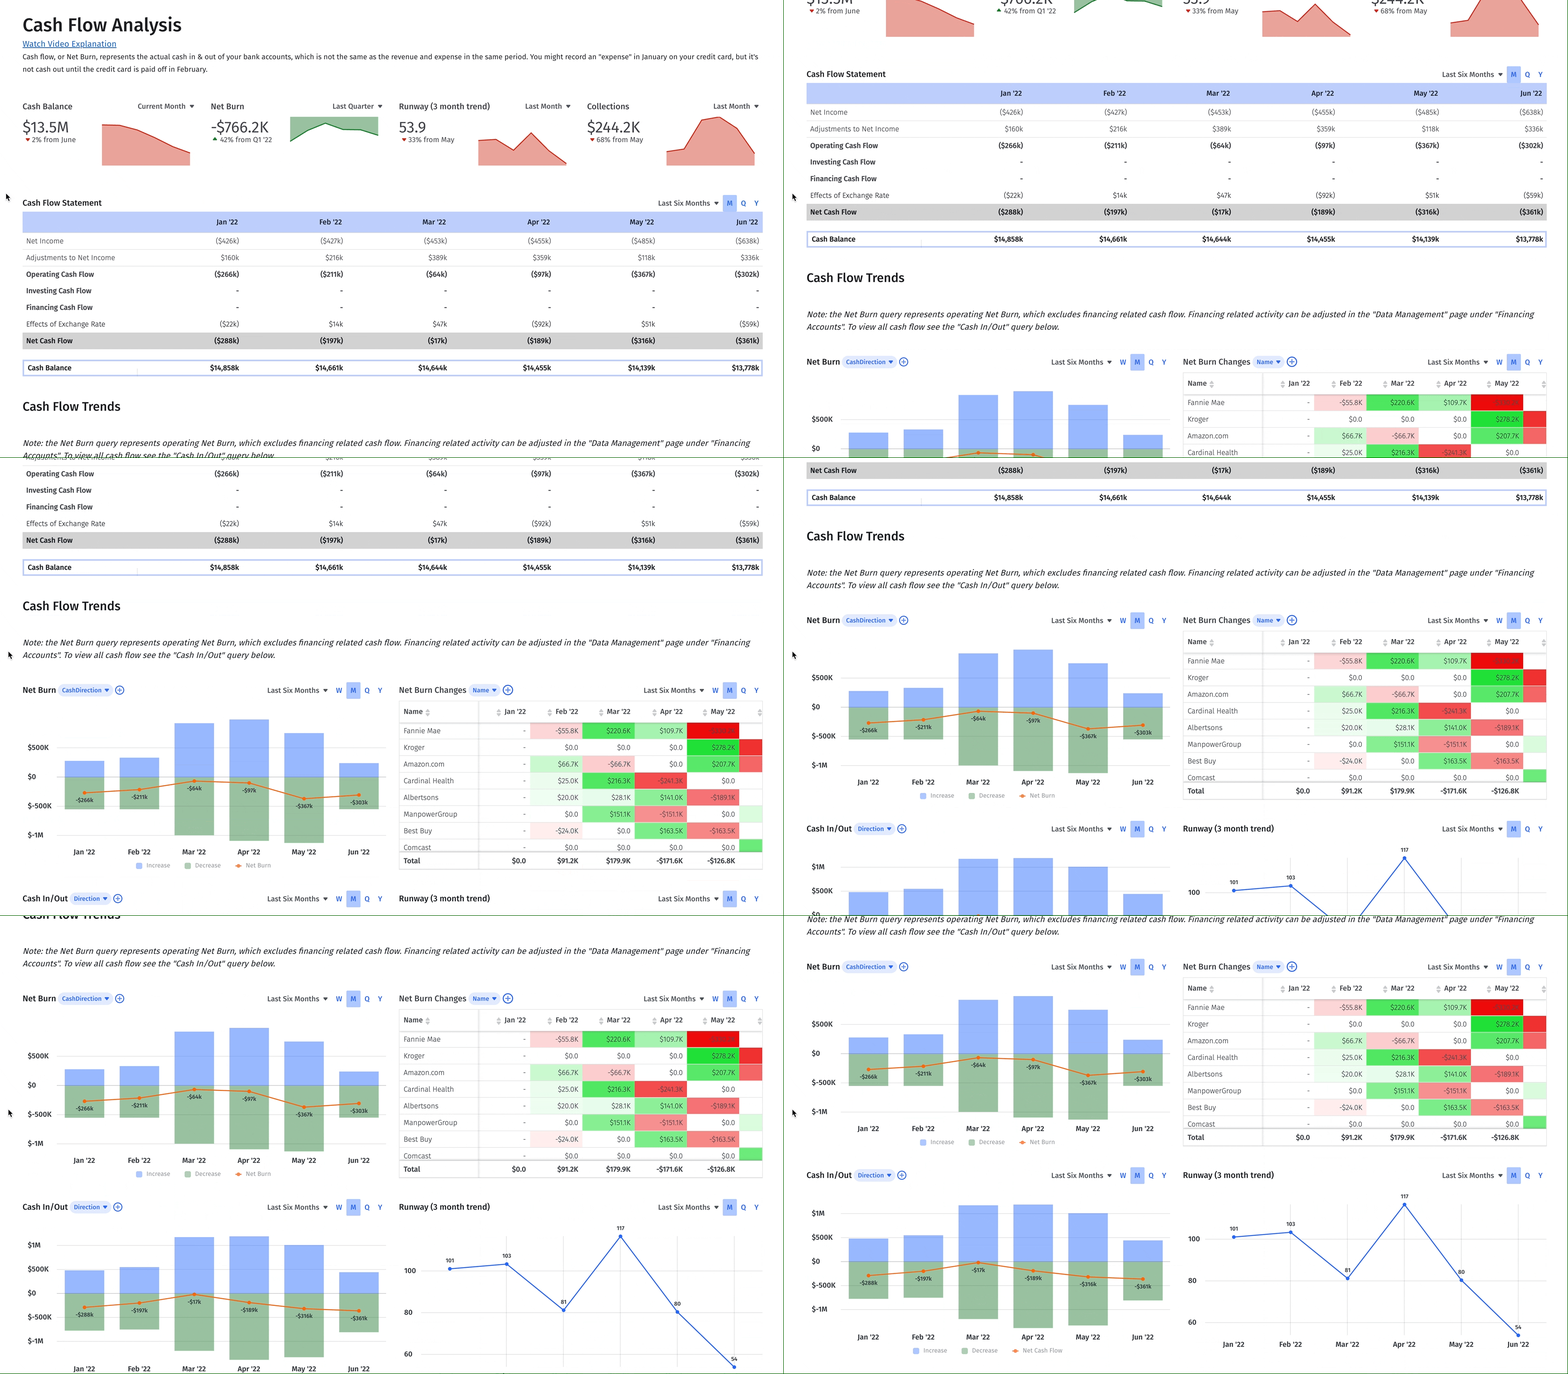
Rather than relying on quarterly numbers, Sourcegraph turned to Strategic Finance Platform Mosaic to get real-time visibility into the metrics they needed. Integrating with Mosaic gave them instant access to the most recent metrics, along with historical data. Sourcegraph’s finance team can now consolidate TTM revenue metrics like ARR, ARR changes, and net burn into a single, easily accessible dashboard that offers a shareable view of their cash position at any point.
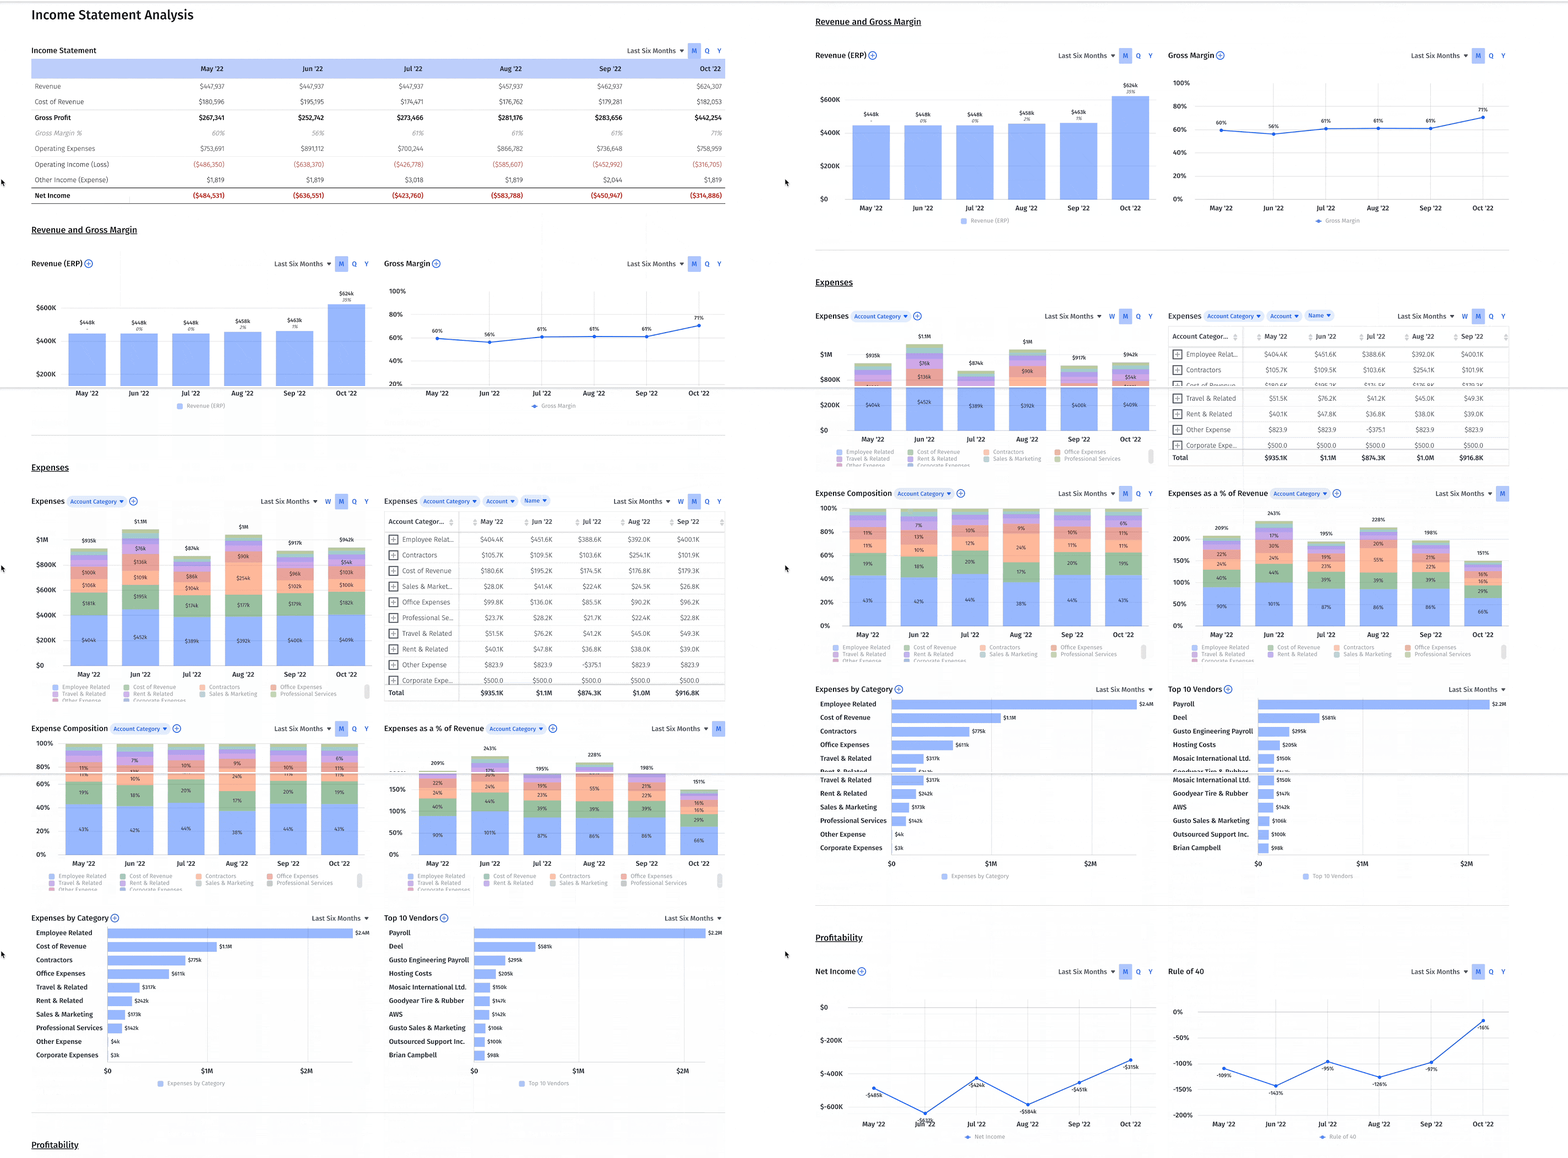
Analyzing expenses is also easier for Sourcegraph with the help of pre-populated reports that pull in transaction-level data. This offers a consolidated list of department and account level expenses, making analysis of variance reports faster and easier. Finance can now triangulate the long-term impact of high-variance expenses in a one-click, seamless experience.
As Sourcegraph learned, viewing metrics on a TTM basis bolsters finance’s position as a strategic partner in the business. Mosaic’s SaaS dashboards, like the cash flow analysis dashboard pictured below, provide accurate, up-to-date access to the metrics that matter. Now, finance can tell the whole story of the company’s financial performance, starting today.

TTM Analysis with Mosaic
Annual financial reporting has its place, but it doesn’t provide the latest information to help stakeholders make proactive decisions to improve performance. Viewing metrics on a TTM basis provides clean, current data, so you can get at the “why” behind the numbers. Rather than working with the previous year’s numbers, or even the most recent quarter, you can start with today’s data and look at the previous full year to monitor the company’s financial vital signs.
Mosaic’s powerful analysis canvas helps you organize your data into financial dashboards and financial reports that support strategic insights and help you spot trends, identify pain points, and fine-tune financial efficiency. Use Mosaic’s pre-built templates or build customized financial dashboards and reports to track all your TTM metrics and give you automated real-time access. You’ll get the clean data you need to assess the company’s performance without the hassle of pulling data from various different platforms and spreadsheets.

This finance automation gives you the time, space, and real-time insight to collaborate across departments and drive down into the numbers and the stories behind them. And since Mosaic gathers and integrates all your data in one place, you can create agile scenario planning examples informed by a full year’s worth of data (or more once you have multiple TTM data sets).
Ready to learn how this level of data can improve your financial storytelling? Ask about a personalized demo to see how Mosaic can help you integrate TTM metrics. Work proactively instead of retroactively to improve your company’s financial performance.
TTM FAQs
How do you find TTM?
TTM figures are typically included on a company’s quarterly balance sheet. TTM in finance is generally calculated by adding up figures from the previous 12-month period (or four quarters) as a sum, or by using the most recent year-to-date period, plus the last complete fiscal year, minus last year’s year-to-date period.
How do you analyze TTM?
What is the difference between TTM and LTM?
Own the of your business.


