Collections Performance Metrics
What Are Collections Performance Metrics?
Collections performance metrics are a set of key performance indicators (KPIs) that help you evaluate your company’s ability to efficiently collect cash from customer payments in a given time period. These metrics give you a better understanding of current and future cash flow, giving you critical insights for managing the financial health of the business.

Categories
Any effective cash flow analysis should give you actionable insights that can help improve your company’s operational efficiency and profitability. And the metrics you use to build out that cash flow analysis can significantly impact the strategic value of those insights.
Cash inflows and outflows are the basic building blocks and a clear view of cash runway is critical. But there are plenty of metrics in between that will help you dig deeper.
Your cash collections process is one area where you want to use multiple metrics to understand performance. These processes impact not only your cash flow, but your overall customer relationship and retention strategies. Establishing and analyzing the right collections KPIs provides a strong foundation for actionable insights that supersede incurring debt and pave a smoother path for the company’s growth.
The 12 Most Important Collections Performance Metrics and KPIs
Your company’s growth stage and business model set particular benchmarks for your collections KPIs and performance metrics. But one thing is clear: Whether you’re approaching a funding round or prepping a board deck for stakeholders, you want to ensure that you show the company’s collections management and debt reconciliation efforts are efficient.
As collections focus on cash inflow from customers, there’s an immense overlap in accounts receivable KPIs with collections metrics. These AR and collections KPIs come together to help you uncover deeper insights that turn into strategic decisions.
1. AR Aging
AR aging is a metric that lists the current amount of overdue invoices from customers based on days since the invoice due date. You’ll form an AR aging report that organizes customer invoices by customer name, invoice number, and your aging schedule (30-day date “buckets” that provide a range of time since the invoice’s due date).

Tracking customer invoices allows you to keep tabs on your customers’ financial health. If customers continually fall into late payments, you can dig into improving your follow-up communication, whether that’s sending invoice payment reminders sooner or setting up a call with the customer to find a viable solution.
2. AR Turnover Ratio
The AR turnover ratio is a key metric in evaluating your collections efficiency. The higher the number, the better your team is at collecting payments (and the higher your cash inflow). If the number is low, evaluate your collections processes, which may include tightening your credit policies.
To calculate your AR turnover ratio, divide your net credit sales by your average accounts receivable.

3. Average Days Delinquent (ADD)
The average days delinquent metric supplements AR aging reports by telling you the average number of days invoices are overdue.

The lower the number, the better you are at following up with customers about invoices (and getting them to pay you). To take ADD even deeper, you’ll want to examine the behaviors of customers with overdue invoices. You can then flag any accounts that seem to be on a trajectory toward delinquency.
4. Bad Debts to Sales
Your bad debts to sales is a ratio that tells you the percentage of uncollectible receivables that will never be paid. Take your unpaid invoices and divide the number by your total sales.

While the industry standard is to keep this number below 15%, ideally you can keep it at zero. Flag any customers whose invoices go beyond your aging schedule or expectations for resolving invoices. You may also want to implement late payment fees to make up for any bad debt, or offer incentives to avoid accumulating debt.
5. Total Billings
Your total billings is the total amount invoiced to customers (minus credit memos) for a specific period of time. You’ll simply add all of your invoices together, whether it’s by month, quarter, or year. Look at both your ERP and billing system to cross-reference for any discrepancies.
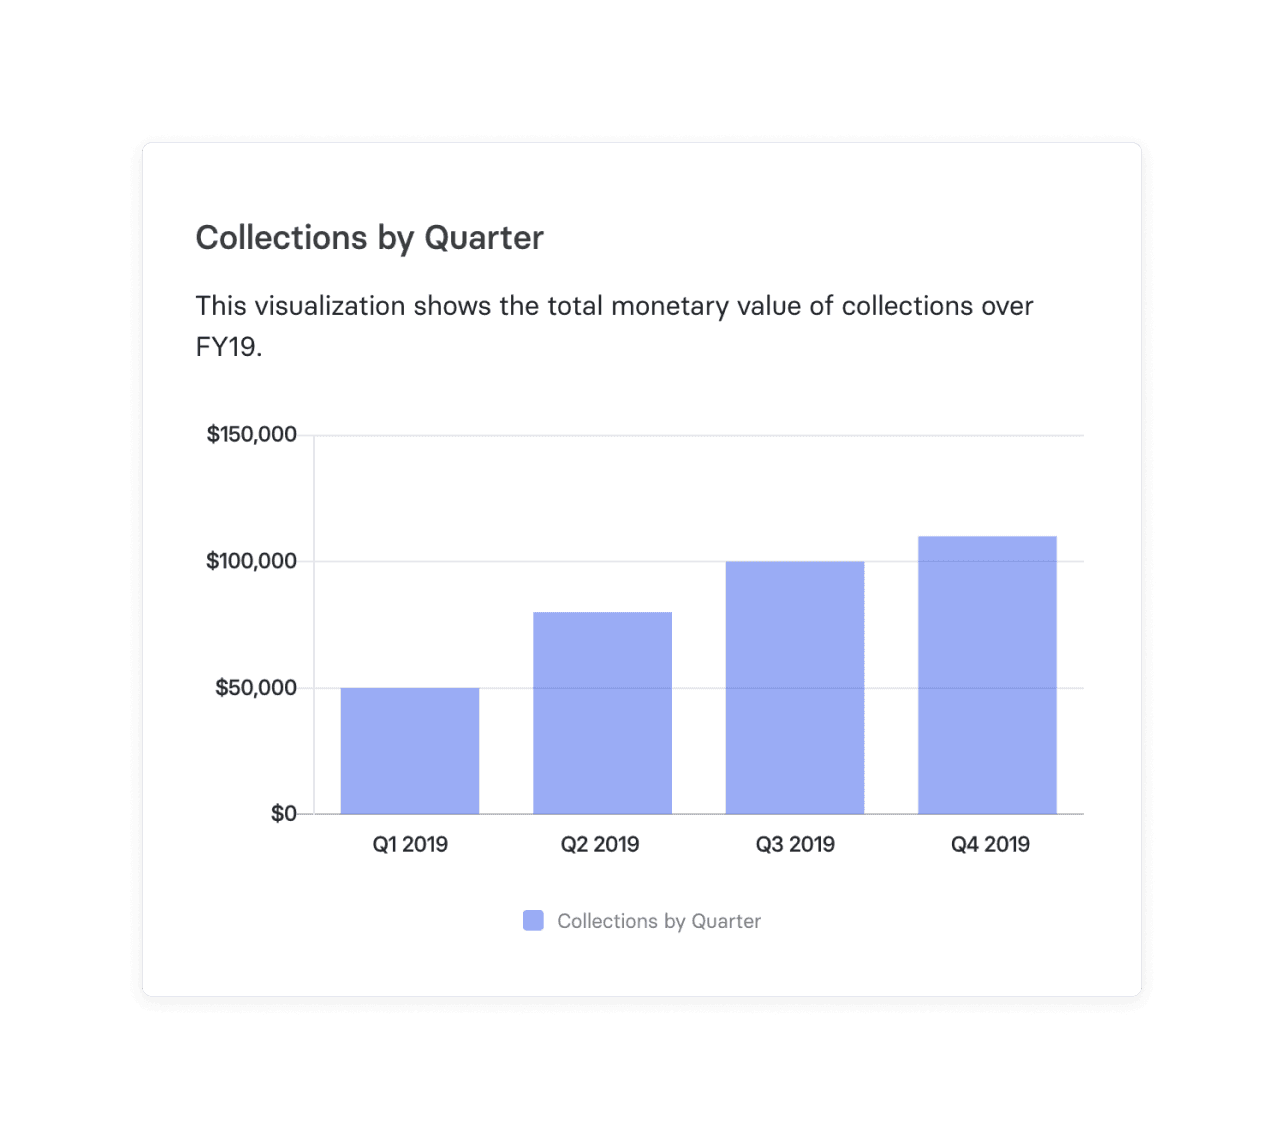
6. Total Collections
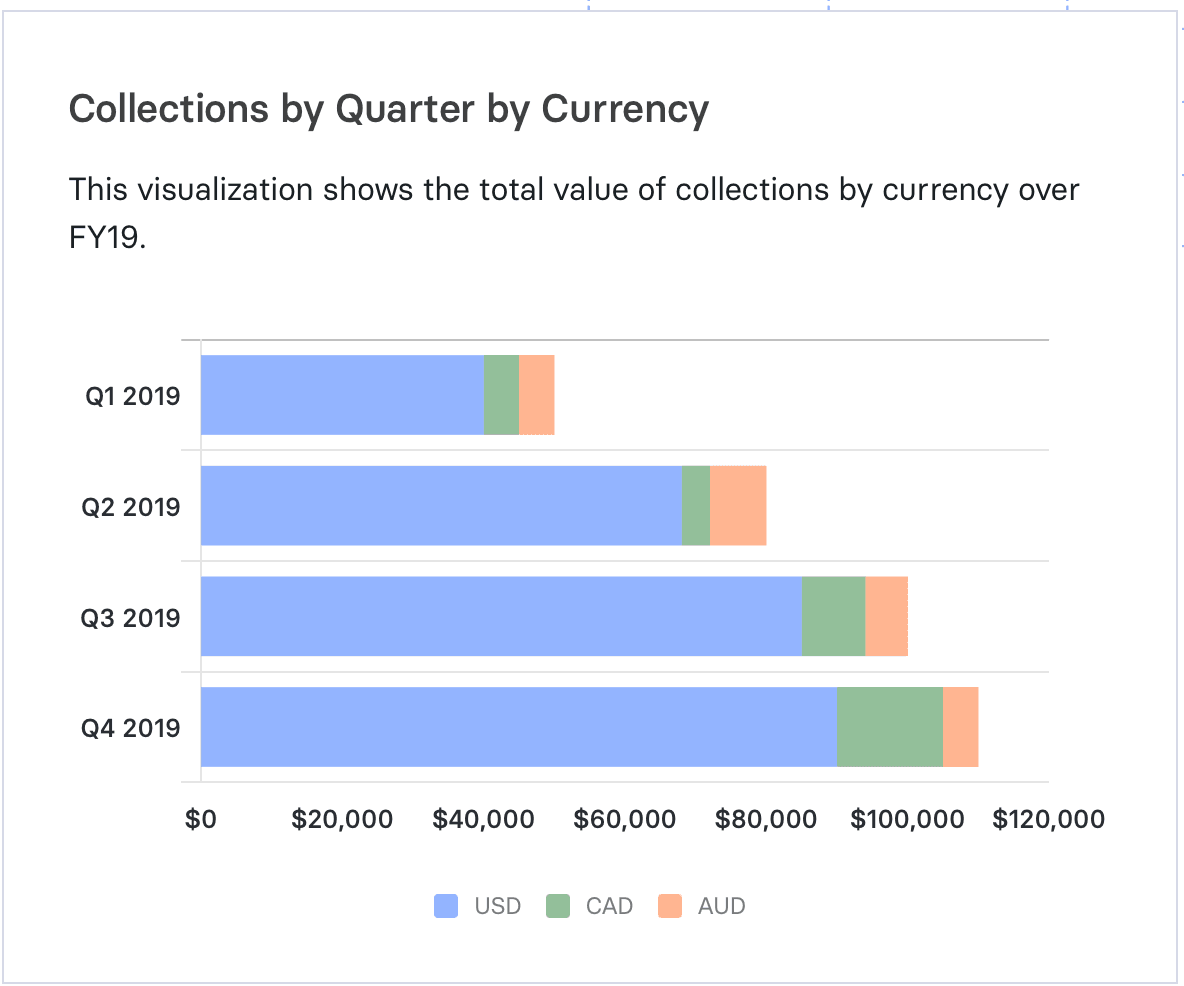
Your total collections serves as a useful metric to determine how much cash you’re bringing into the business. Your total collections metric is most impactful when you view it as a percentage of all outstanding customer invoices, which provides further insight into where you can develop better collections processes to recover outstanding invoices.

You’ll want to cross-reference your collections against your ERP and billing system for any discrepancies.
Breaking total collections out by currency and quarter gives you a simple overview of cash inflows. But you can go a step further by viewing collections by customer cohorts. Segmenting helps you surface insights for marketing and sales so they can make any necessary adjustments to ideal customer profiles.
7. Collections Effectiveness Index
Efficiency is the name of the collections metric game. Your collections effectiveness index (CEI) measures the efficiency of your collections team.

While a perfect 100 CEI score would be ideal, market conditions make that a bit difficult to achieve. But you want that number as close as possible, meaning you can look at optimizing your collection efforts to ensure proper communication with debtors, consistent follow-ups on invoices, and error-free invoicing.
8. Days Sales Outstanding (DSO)
Your day sales outstanding (DSO) is the average number of days it takes for customers to pay their invoice. While the aging schedule on your AR aging report buckets invoices into a date range, diving into the specific number through your DSO allows you to flag when customers may have some financial health issues going on.

A high DSO indicates that customers are taking too long to pay their invoices. You can aim for a lower DSO number with incentives (like discounts for early payments) or penalties (adding fees for late payments).
9. Invoice Status (Amount)
Your invoice status by amount is a comparison between how much cash has been paid versus what still needs to be collected (a.k.a. your open invoices) within a specific time period. You’ll use this collections KPI to see how you’re progressing on your collections efforts.

10. Invoice Status (Count)
Invoice status by count is a high-level, basic overview of how many paid invoices you have compared to open in a given time period.

Your invoice counts specifically look into your follow-up initiatives and processes when it comes to collecting from customers. If the number of overdue invoices remains high, you may need to look at expanding your collections team or offering customers payment plans or discounts to ensure payment.
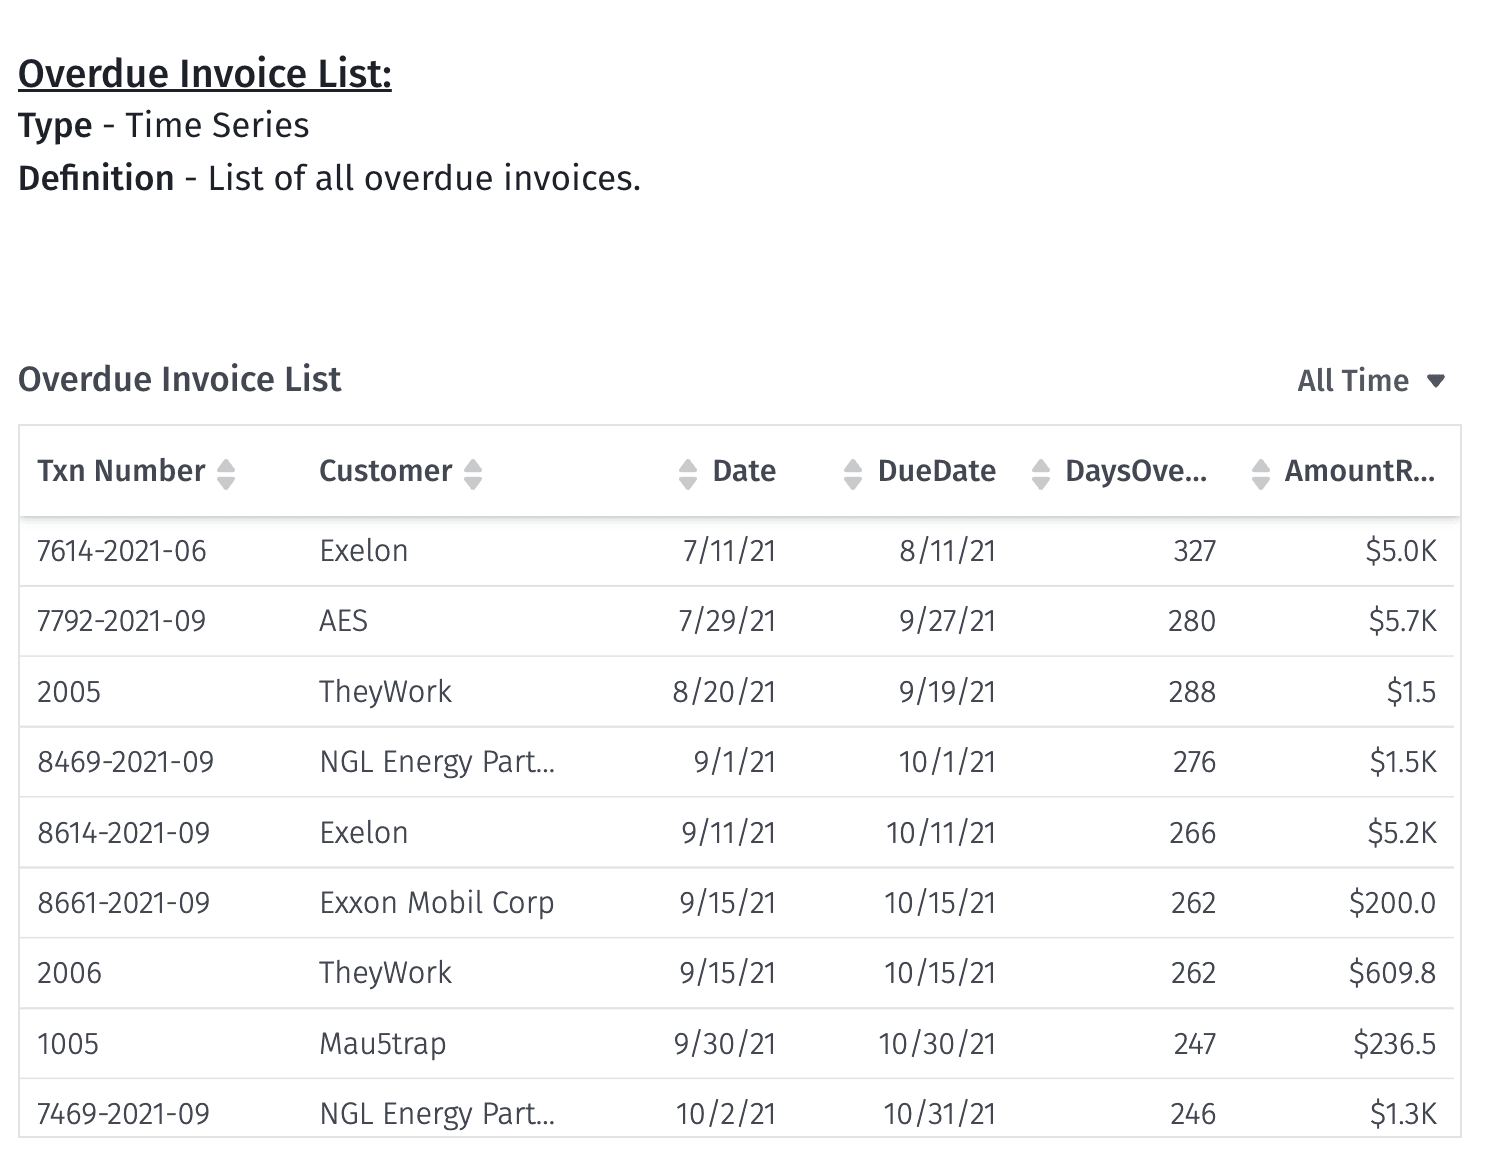
11. Overdue Invoice List
Your overdue invoice list is a high-level view of customers with overdue invoices.

Your AR aging report offers a deeper dive into this list, as it includes individual invoices per customer along with where each invoice falls within the aging schedule. You can analyze customer behavior based on overall DSO patterns, or identify if customers are continuously falling behind in payments to flag as potential bad debts.
12. Percentage of Outbound Calls Resulting in Promise to Pay (PTP)
This collections KPI measures collection team efficiency and success rate. You’ll first need to successfully have a high right party contact (RPC) rate, where the collections team contacts the right point person for the customer you need to collect from.
Your PTP sounds straightforward: the point person promises to pay the debt. Looking at both metrics in tandem, you can see how your collections efforts build in terms of timing and efficiency. You want these ratios as close to 100% as possible, which means constantly evaluating your outreach methods and billing systems to ensure everything is functioning as it should. And if the customer ends up not fulfilling their promise, let their customer service representative know so they can take the necessary steps to find a solution or cut services.
Track Collections Performance Metrics in Real-Time with Mosaic
While some companies may outsource their collection efforts to a collection agency, that could be a huge hindrance for small businesses who want to control their runway as they build their product. And for companies in mid-growth stages, ensuring cash inflow and keeping customer satisfaction high is integral to further growth goals — which is why you can’t have your team bogged down in chasing after cash when they could spend time in more strategic work.
Mosaic is a Strategic Finance Platform that integrates with your ERP and billing systems to offer real-time updates on your accounts receivable and collections. You’ll find many of these essential collections metrics and KPIs pre-populated in Mosaic’s billings and collection and financial dashboards, which provide high-level visibility into your cash inflow efforts.

And with just a few clicks, you can dig into the metrics to discover the next step toward improving efficiency in both your operations and your collections processes.
Request a demo today to see how Mosaic can help you monitor your collections performance in real time and improve cash flow management.
Collections Performance Metrics FAQs
How can improving collections efficiency impact a business?
Improving collections efficiency can significantly impact a business by increasing cash flow, reducing the number of days sales outstanding (DSO), and minimizing the risk of bad debts. Efficient collections processes ensure that businesses can recover owed money more quickly, which in turn supports better financial planning, investment in growth opportunities, and maintenance of healthy customer relationships.
What are some key collections performance metrics that should be monitored?
Explore Related Metrics
Own the of your business.


