Average Sale Price (ASP)
What Is Average Sales Price?
The average sales price (ASP) is the average price a customer pays when first purchasing a product or service. In SaaS, ASP is often referred to as average revenue per new account and is a segment of average revenue per account (ARPA).
It doesn’t include revenue from renewals or upgrades. For example, if a SaaS company makes $1,000 in subscription fees from 10 new subscribers, the ASP would be $100.

Categories
Average sale price (ASP) is a crucial sales performance metric for SaaS companies. In the SaaS business, an in-depth analysis of the ASP offers you the opportunity to assess sales team performance and your product’s market fit.
While the generic ASP of a product is useful to determine its demand, more granular ASP data will give you deeper insights into your business. For example, breaking down your ASP by region will help you understand which markets have larger deal sizes.
Let’s explore how to calculate the average selling price and the benefits of tracking the ASP metric.
Table of Contents
The Importance of ASP as a Financial Metric
The average sales price is a key metric that helps existing and new companies make strategic decisions about their business. For instance, startups can create a SaaS pricing strategy by looking at the average sales price in their industry.
If you break down the ASP of a product by market segments or regions, you’ll know where your product or service is doing well. That helps determine how much you should spend on ads in each region or market segment.
Tying ASPs to customer personas also helps you identify loyal customers. You can upsell to specific customer segments and improve the net promoter score (NPS) through targeted marketing with these metrics.
The average selling price also helps SaaS companies decide on an upper limit for customer acquisition costs (CAC).
How To Calculate the Average Sales Price in SaaS
SaaS companies can calculate their average selling price by dividing total ARR from new customers in a period by the number of new customers they signed in that period.

Assume a cloud-based storage company sells 12-month contracts for anywhere from $16,000 to $30,000 per year, depending on the level of service and feature selections. To determine the average selling price for customers signed in a certain month, you’d take the total of all closed-won deals (let’s say it’s $240,000 in this case) and divide by the number of customers signed (let’s say 10).
The ASP for this company would be $240,000 divided by 10 customers, which is $24,000.
Remember: When calculating ASP metrics for SaaS, you should only consider the revenue made from new customers for a particular service in a specific period.
Track and Segment ASP Metrics with Strategic Finance Software
Median Sales Price vs. Average Sales Price
The average sales price of a product or service is calculated by dividing the total revenue by the number of customers. The median sales price (MSP) is a similar SaaS metric.
However, to calculate the MSP, you need to arrange all the sales prices in ascending or descending order and pick the value at the midpoint of the list.
For example, let’s say you have closed five deals for $1,000, $1,125, $800, $1,230, and $1,140 in the previous month. Here’s how you’d calculate the ASP:
Average sales price = ($1,000+ $800+ $1,125 + $1,230 + $1,140) / 5 = $1,059
Now let’s calculate the MSP. First, we’ll arrange the sale prices in ascending order: $800, $1,000, $1,125, $1,140, and $1,230. Next, we’ll pick the value in the middle.
Median sales price = $1125
Not every company will look at ASP and MSP in tandem. But if your ASP seems off, it may make sense to sense-check it against your median sales price. If ASP deviates greatly from your MSP, you may be able to pick out a few outlier deals that skewed the average.
For example, you could have a sales rep consistently landing higher-value customers compared to the rest of the team. Or, you might have signed a few customers who weren’t the best fits and delivered unusually small deal sizes.
What Can Company Leaders Do With the Average Sales Price Metric?
A company’s average selling price might not offer much strategic value at a high level. However, the ASP metric will benefit business leaders if they cut into more granular ASP data.
Let’s see how to break down the average selling price and the insights it offers.
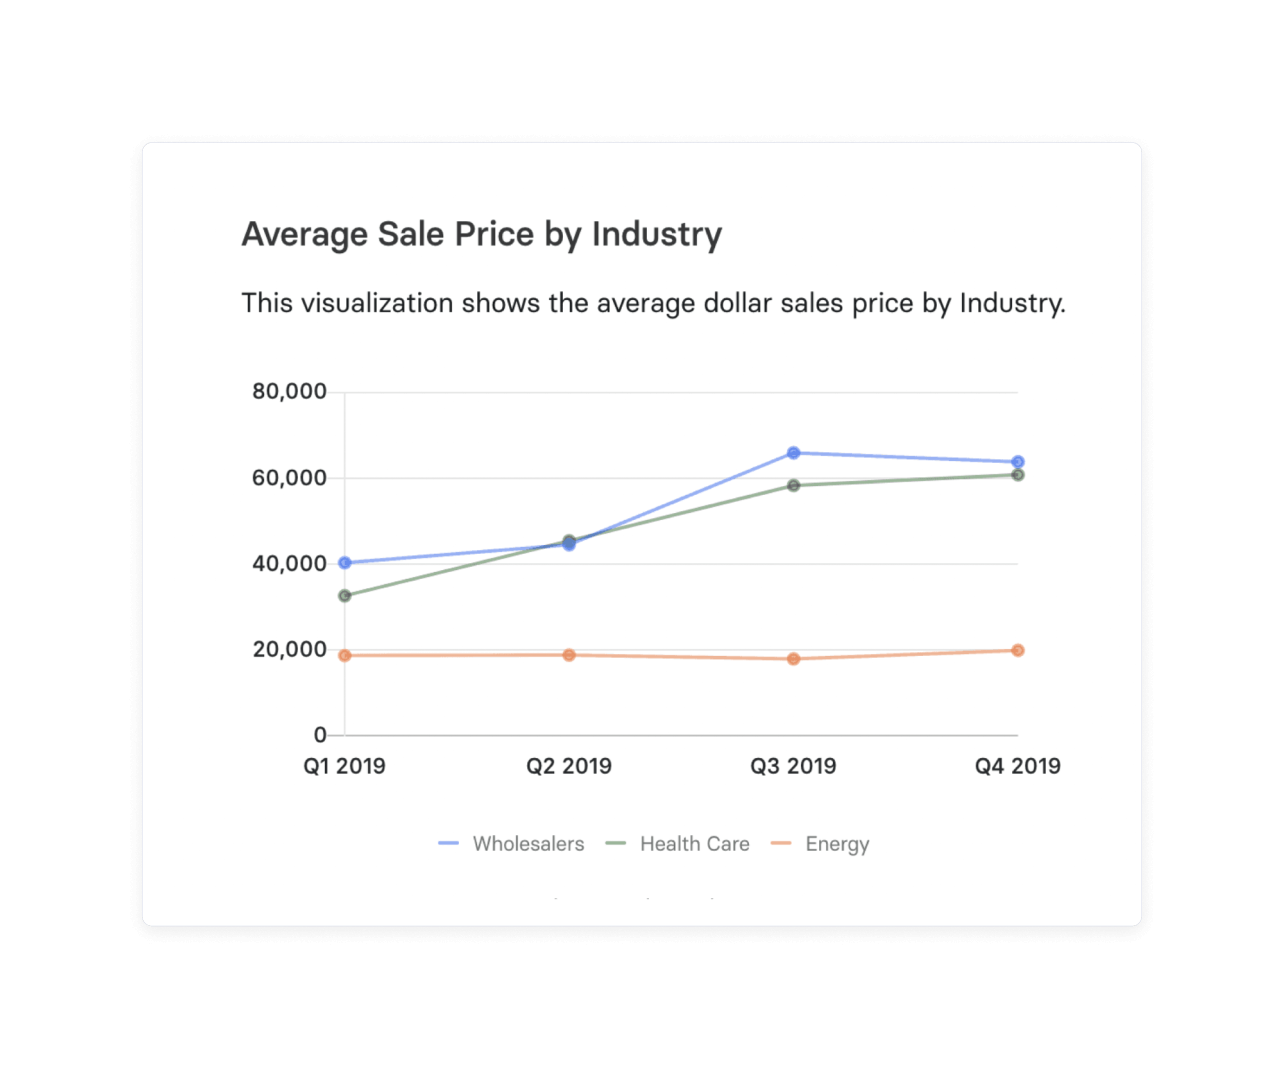
Collect Average Sale Price by Industry
If your business spans multiple industries, it’s good to compare the average selling prices per industry. That way, you can determine which industries drive the greatest revenue growth.

Business leaders use that information to shape investment decisions and develop sales capacity plans.
Analyze the ASP Within Context
The average selling price could mean entirely different things for different companies. While analyzing the ASP metric, you should always do it within context.
For example, enterprises often sell at higher prices than small and medium businesses (SMBs), so it’s best to consider the business model while interpreting ASP.
After all, comparing an enterprise’s ASP to that of an SMB may not yield accurate data. Moreover, ASP alone can’t determine how a type of product is doing. While making decisions, business leaders need to consider other key performance indicators such as:
- Customer lifetime value (CLV or LTV).
- The average revenue per account/user (ARPA or ARPU).
- Annual contract value (ACV).
- Customer retention metrics like net revenue retention
A high ASP may not always indicate business growth. If you see a high customer churn rate despite a high ASP, your product/service may not be ready to support complex customer accounts.
Likewise, if a product has a low ASP but a high customer retention rate and revenue, you might still want to invest in that product or segment.
The bottom line is that you need to use the ASP alongside other metrics to make better investment/sale decisions.
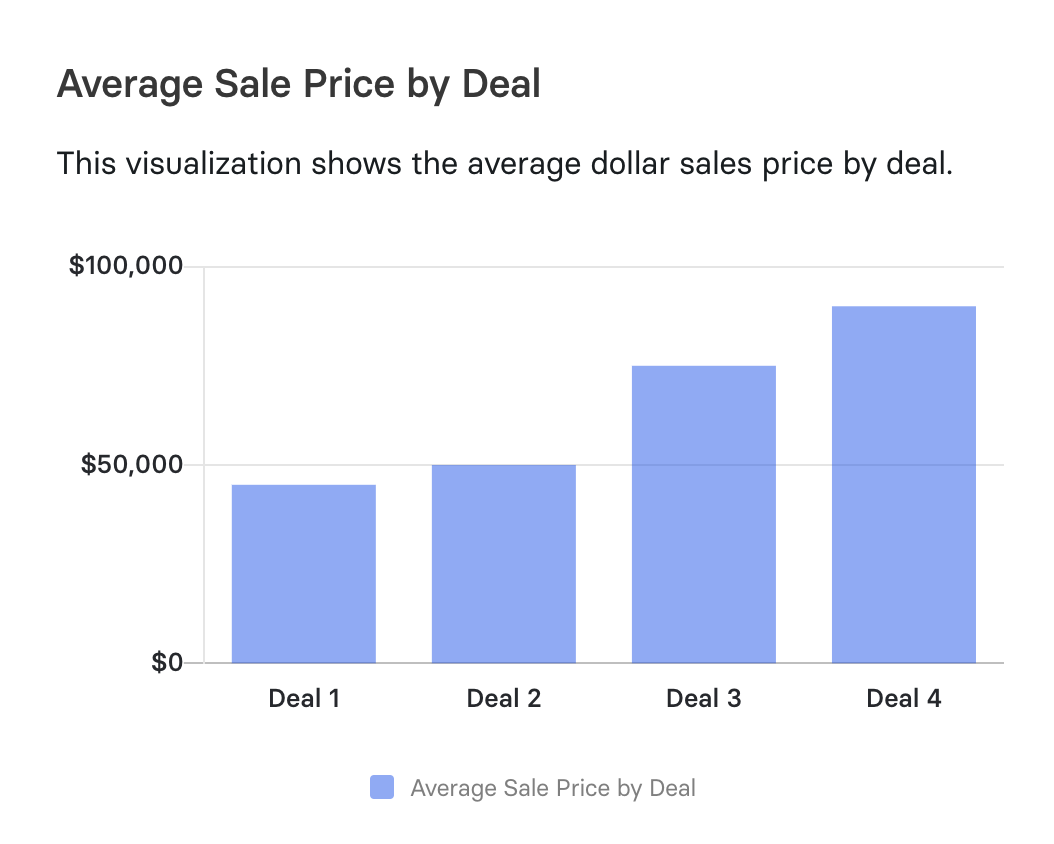
Capture the ASP at a Deal-by-Deal Level
You need to break down the average selling price across sales deals. It’ll help you understand which customer accounts bring in more revenue so you can identify patterns that could inform your sales strategy.

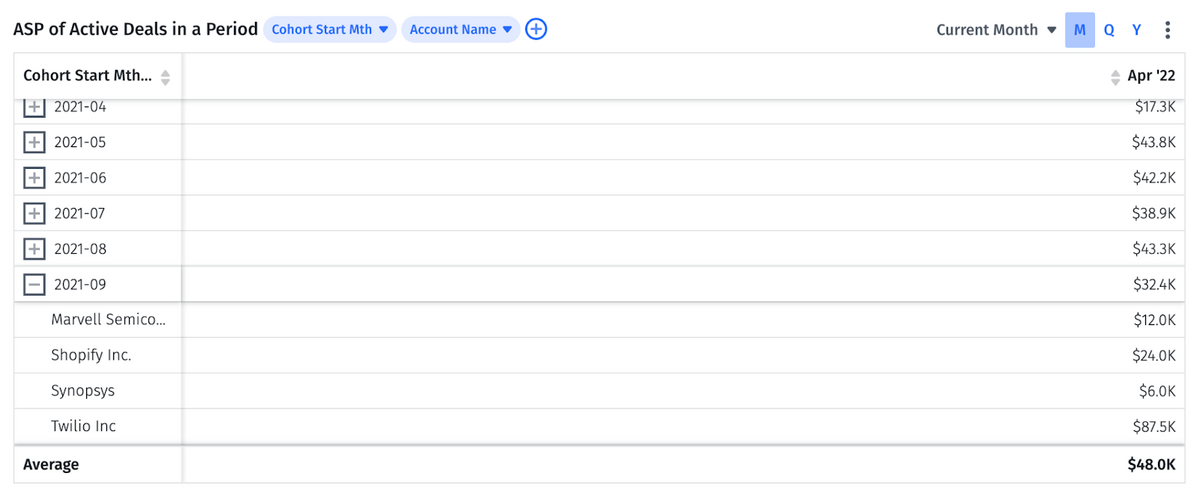
You can take this a step further by specifically analyzing ASP for active deals. Getting that real-time view of the pipeline will help you identify where to allocate resources for sales as you determine which accounts are worth spending the most time on.

Answering the following questions while analyzing ASP will give you more refined insights into your sales process:
- Are there specific company sizes or buyer personas that increase the ASP?
- Are there some support tiers that boost customer satisfaction?
- Have you offered any additional services to boost the ASP successfully?
Break Down the ASP by Sales Rep
The average sale price can be a strong sales performance metric. Breaking down ASP by sales representatives will help you identify top account executives based on their sales.
Learning what they do differently will help other reps to improve their performance. It will also help business leaders improve their pricing strategy.
Get ASP Metrics in Minutes Using Mosaic
Average sales price should be a quick metric for finance teams to look at and communicate to the rest of the business. But more often than not, you have to cobble together data from a chaotic CRM setup to try to create a cohesive data set.
Mosaic will help you collect key ASP metrics and break them down by industry, market segments, or any other dimension you need. We also have automation for complex data analysis, so you will be able to analyze your average sales data in minutes.
To understand how Mosaic can turn your ASP metric into valuable financial business intelligence, request a personalized demo today.
Average Selling Price FAQs
What is average selling price?
Average selling price is another term for average sale price, and it refers to the average price a particular product or service is sold for. ASP can be calculated for an entire industry or product and used as a benchmark when determining your pricing. You can also calculate ASP internally by region, sales rep, or for your business as a whole.
Average selling price is an important metric in many industries. SaaS businesses use ASP to better understand their Average Revenue Per Account. Real estate agents look at the ASP of recent home sales to understand current home value and businesses in the hospitality industry may monitor average room rate or average daily rates in their area to help ensure they have competitive pricing.
Why is average selling price important?
How do you calculate average sales price?
What is the difference between average and median sales price?
Explore Related Metrics
Own the of your business.


