How an Expense Dashboard Helps Track & Analyze Business Expenses
What Is an Expense Dashboard?
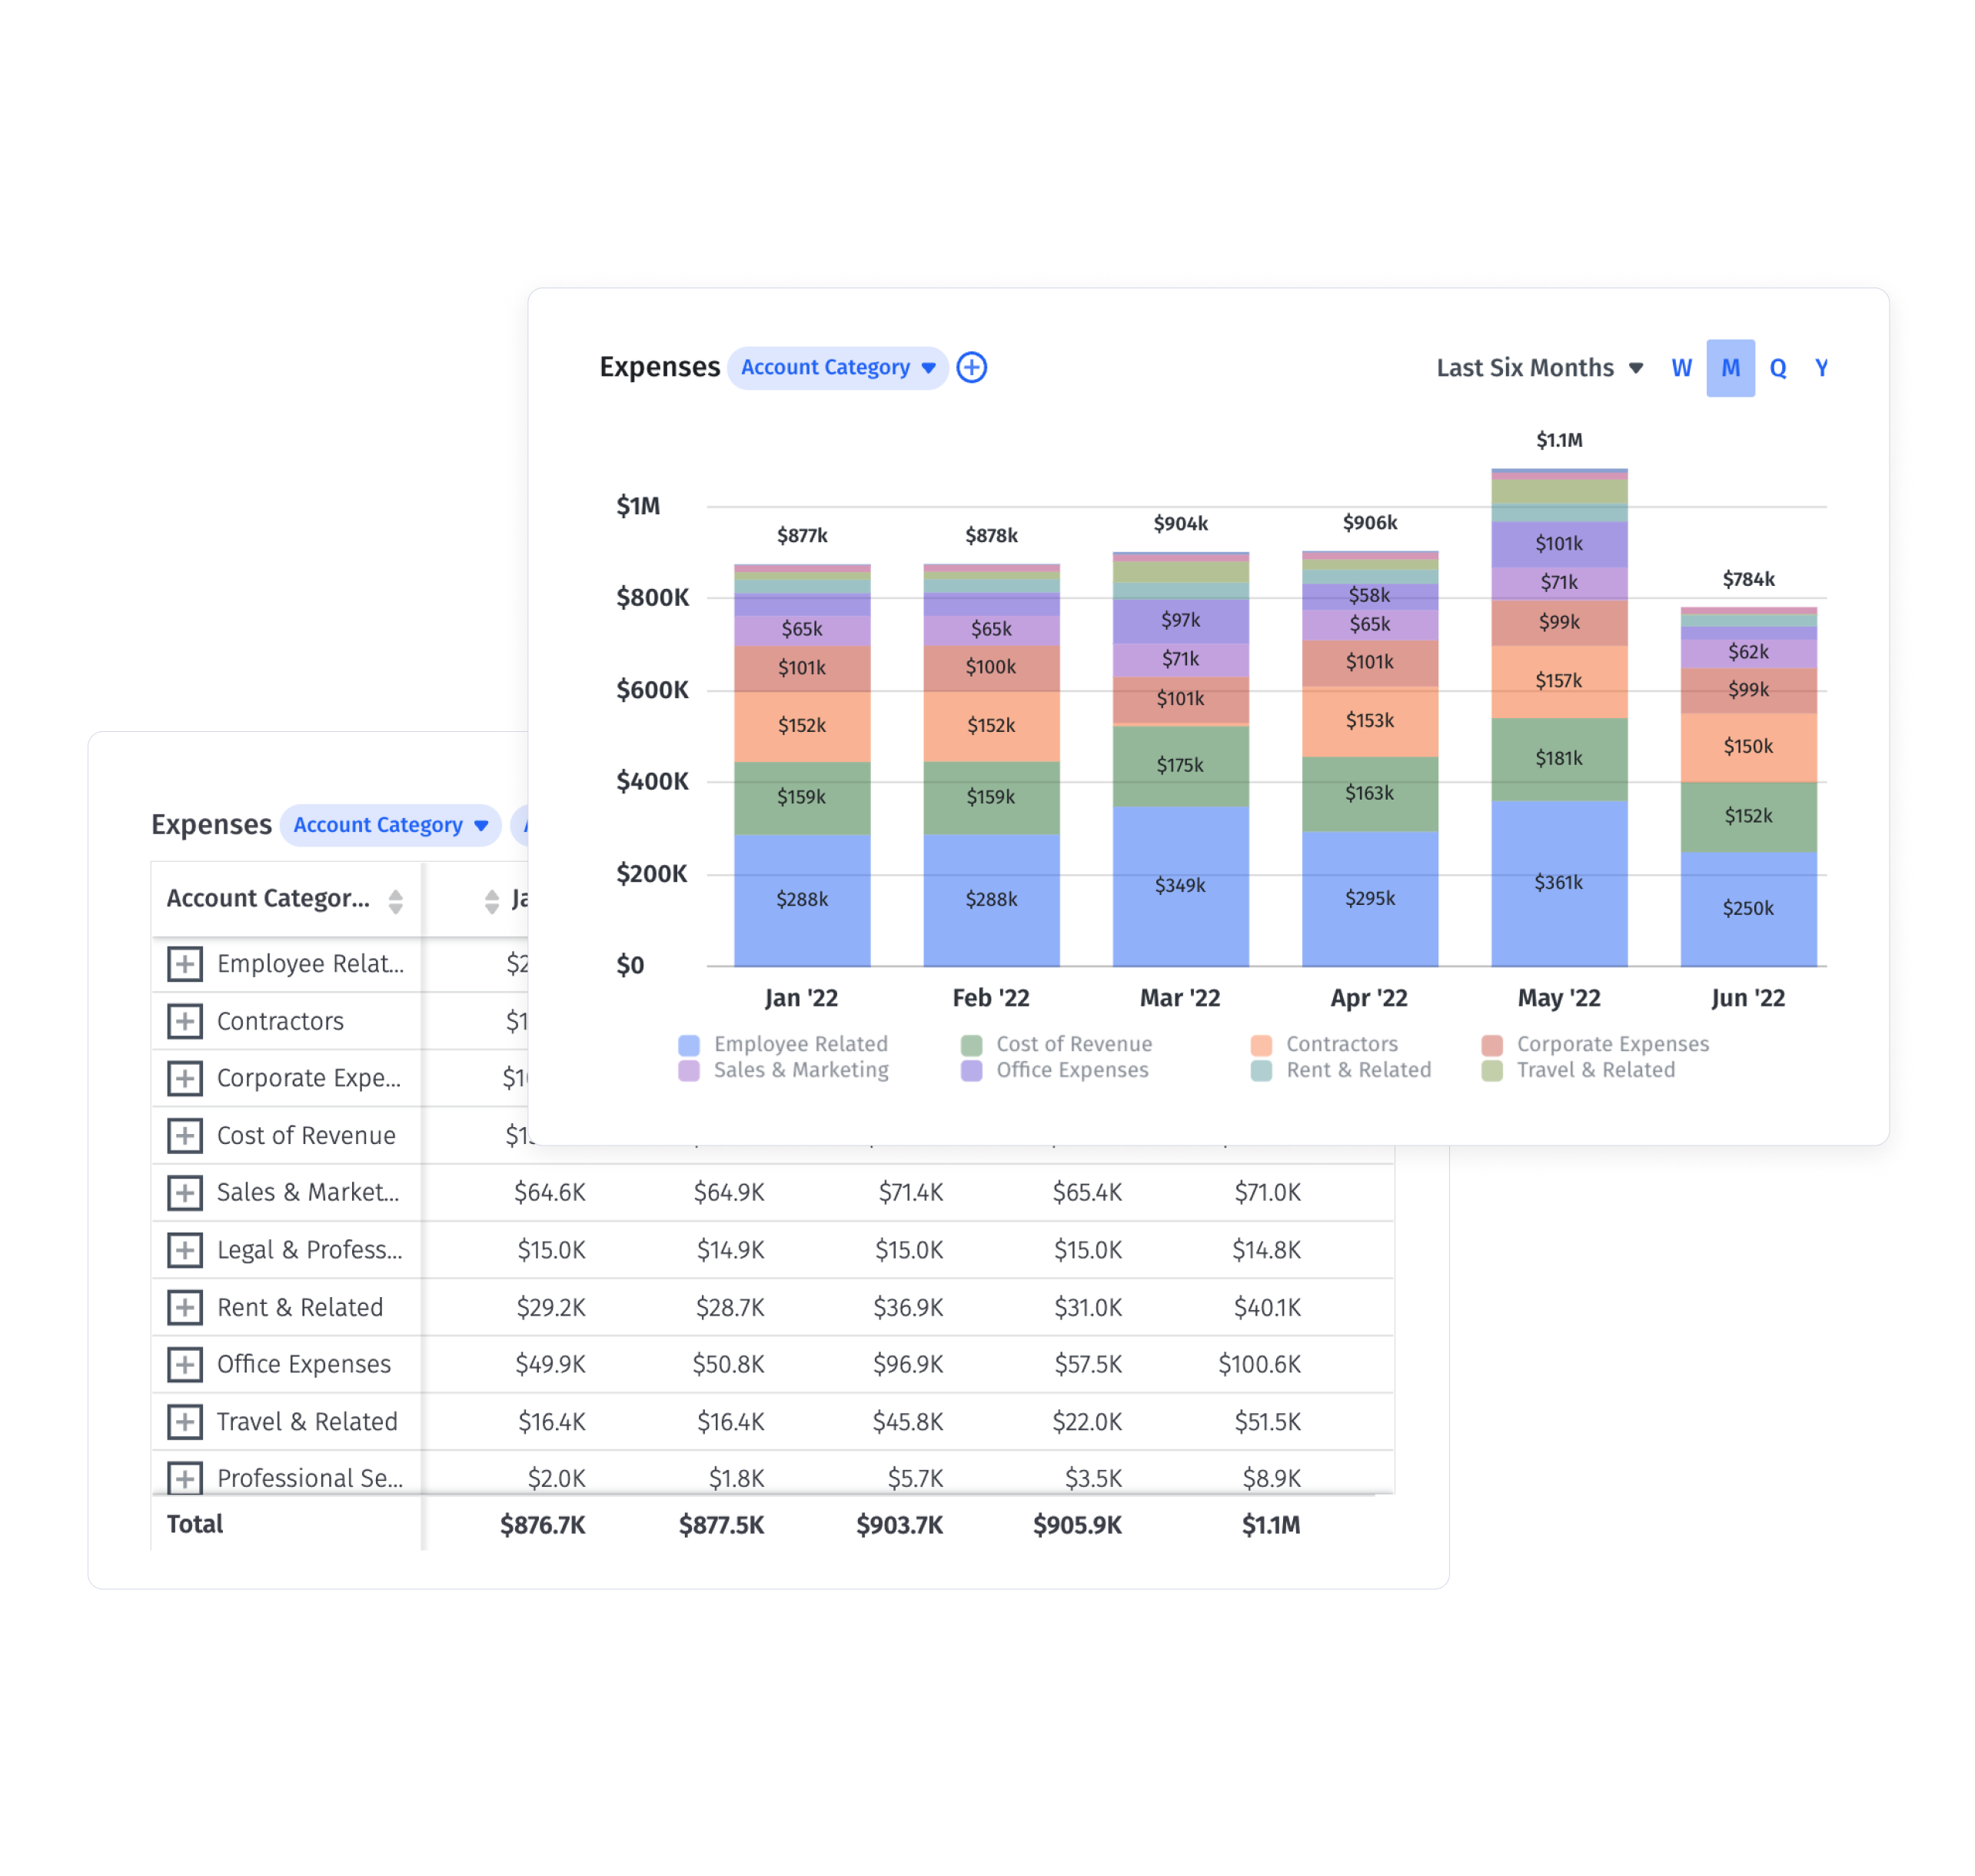
An expense dashboard is a financial analysis tool that provides interactive visuals and allows you to track expenses across the company. These management dashboards should have different graphs and charts that show current expenses alongside the company’s budget to help trend any under- or overspending, which allows you to prompt departments to consider how to improve their spend.
Categories
Table of Contents
4 Key Benefits of Using a Business Expense Dashboard
Here are the benefits you can expect from a business expense analysis dashboard:
1. Visualize Expenses
Looking at expenses on a financial statement can appear intimidating to your business partners, who don’t spend as much time working in that format. Expense dashboards allow you to find a common language with department leaders through the dashboard’s visualization tools, giving them simple ways to understand the numbers.
While financial statements group overall department spend to give a clear picture of expenses, it’s not necessarily the best format for collaborating with department leaders. Look at Salesforce’s income statement as an example. It shows operational expenses broken down by department — but you don’t get granular insights.
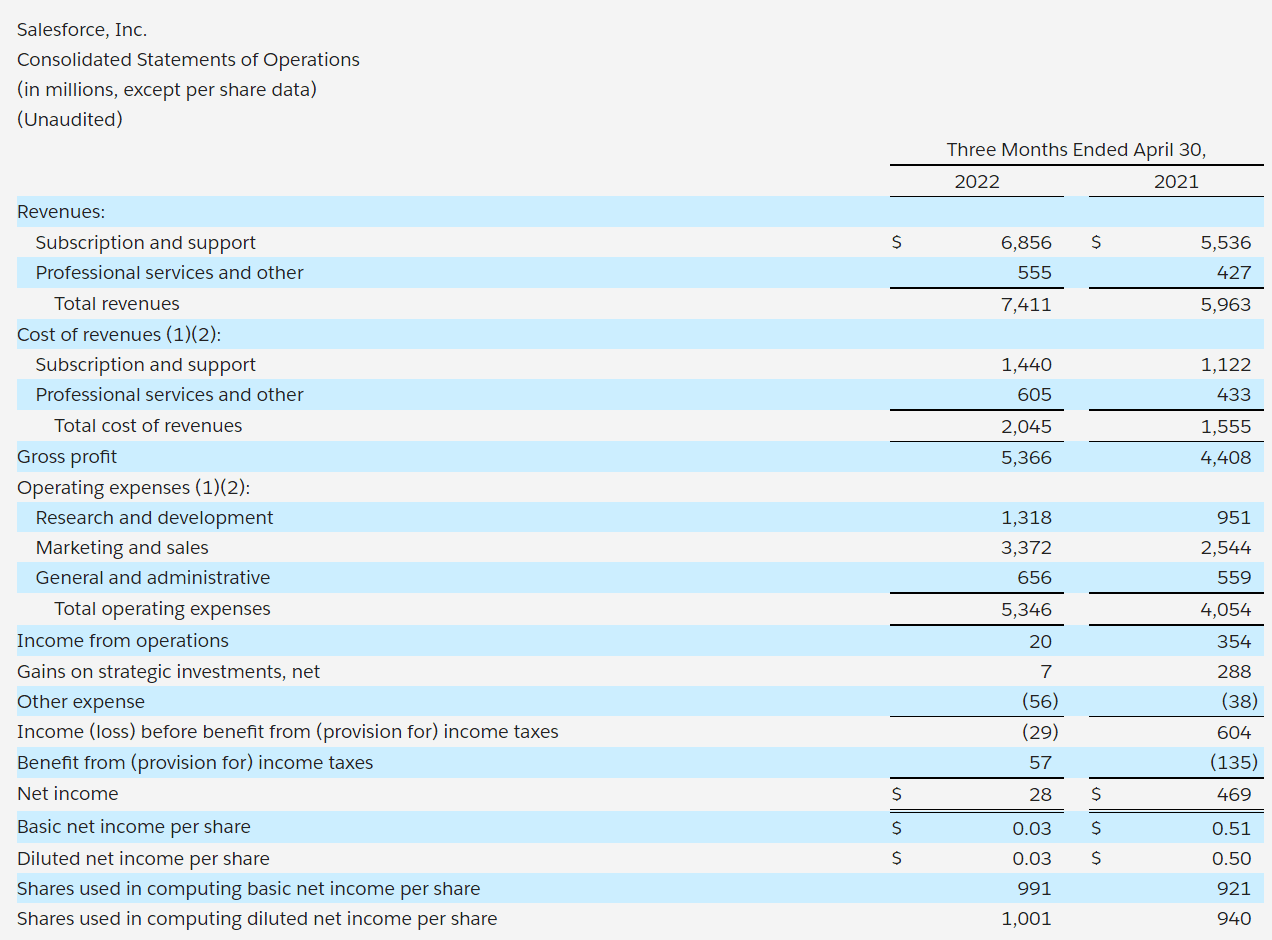
Salesforce income statement. Image sourced from Salesforce.
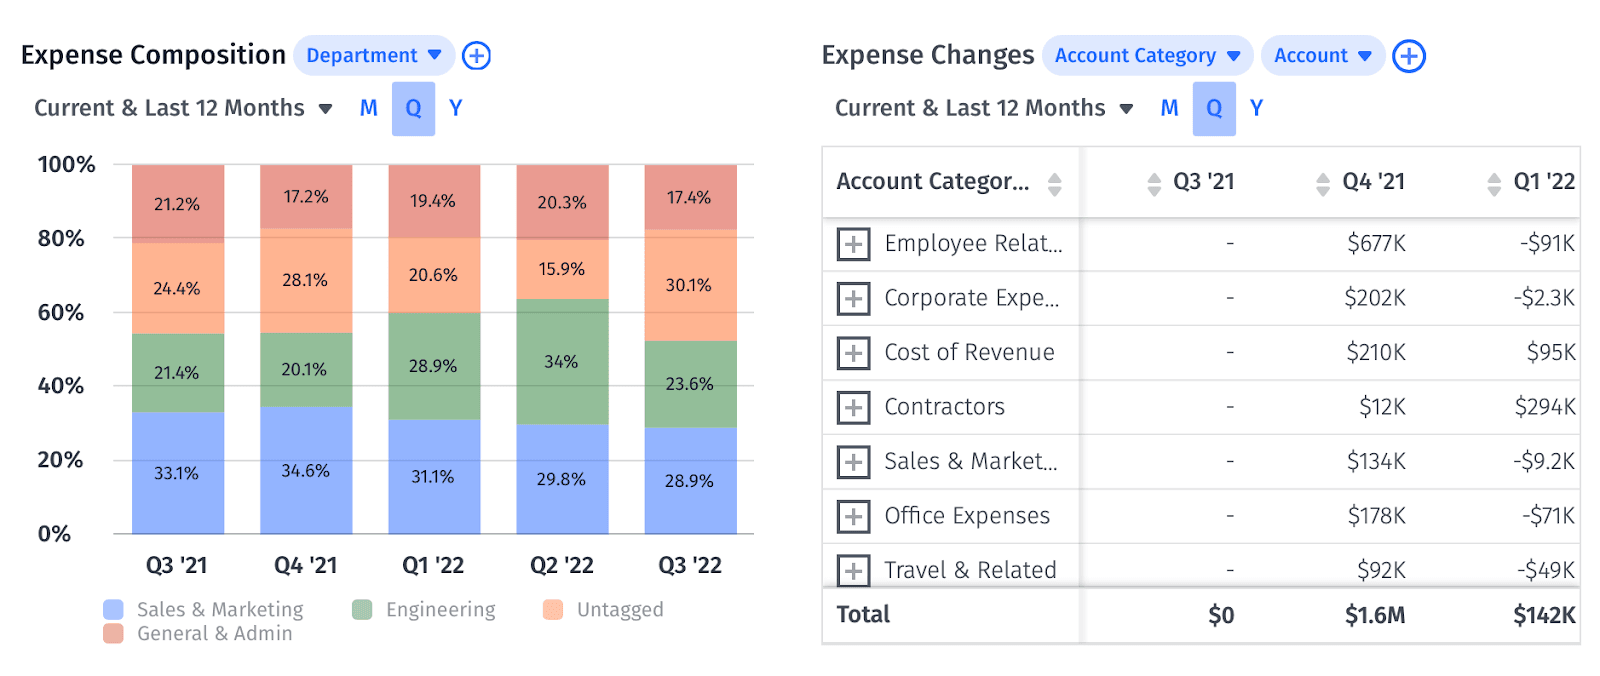
An expense tracking dashboard should give you both the high-level and the granular view of spend. You can see in the image below a high-level overview of expense composition and expense changes.
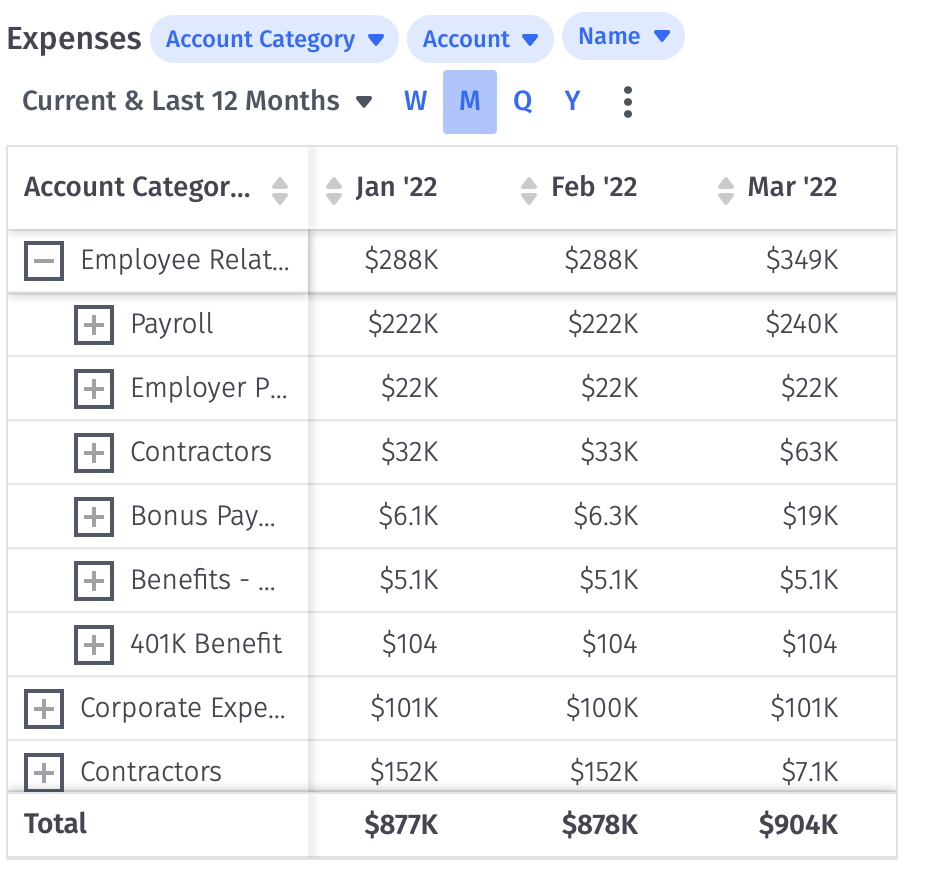
If you drill down into the expense charts in your dashboard, you should get more granular visibility like in the example below.
2. Track Expenses Efficiently
You shouldn’t have to spend time figuring out how to extract the business information you need from multiple Excel or Google sheets per department, which are susceptible to human error and lack of timely updates. An expense tracker dashboard helps with that. You can skip sifting through hundreds of accounting entries as the dashboard connects with your ERP or other sheets to pull information through. While these systems still rely on timely updates, it does cut down on time you spend tracking down information so you can focus on tracking any spending trends and providing proactive insights.
3. Shared Visibility
An expense dashboard can be a single point of truth for spend across your company. You can provide business partners access to the relevant sections of the dashboard, which cuts down on requests for expense-related information. Department leaders can instead check their dashboard at any time, and consider how they can improve their spend or if they need to request more when it’s time to run a budget analysis or determine next quarter’s budget allocation.
4. Expense Management
You can make better decisions to protect and improve your margins once you can see the overall expense information for your business.
While most expenses may be necessary to run your business, you might want to trim a few costs, especially in a market downturn.
You can perform critical project management functions, like monitoring cost overruns, using an expense tracker dashboard. Say the marketing department hired a contractor on an hourly basis for one of their monthly projects, and their budget for that project is $5,000. Two weeks into the month, you see through the expense dashboard that the contractor has already billed $4,900.
Beyond looking at the freelancer’s invoices and validating the project timeline toward completion, you can prompt the marketing department to consider the contractors’ costs alongside the project’s progress. The marketing department can then compare other contractors’ rates to find someone more affordable, or discuss any roadblocks that may have incurred additional fees from the contractor.
7 Business Metrics You Can Track with an Expense Dashboard
Many expense tracking dashboards allow for customization. That way, you get to focus on the metrics that matter to the business.
Here are the common business metrics and KPIs you can track to stay on top of the company’s expenses:
1. Cost of Revenue
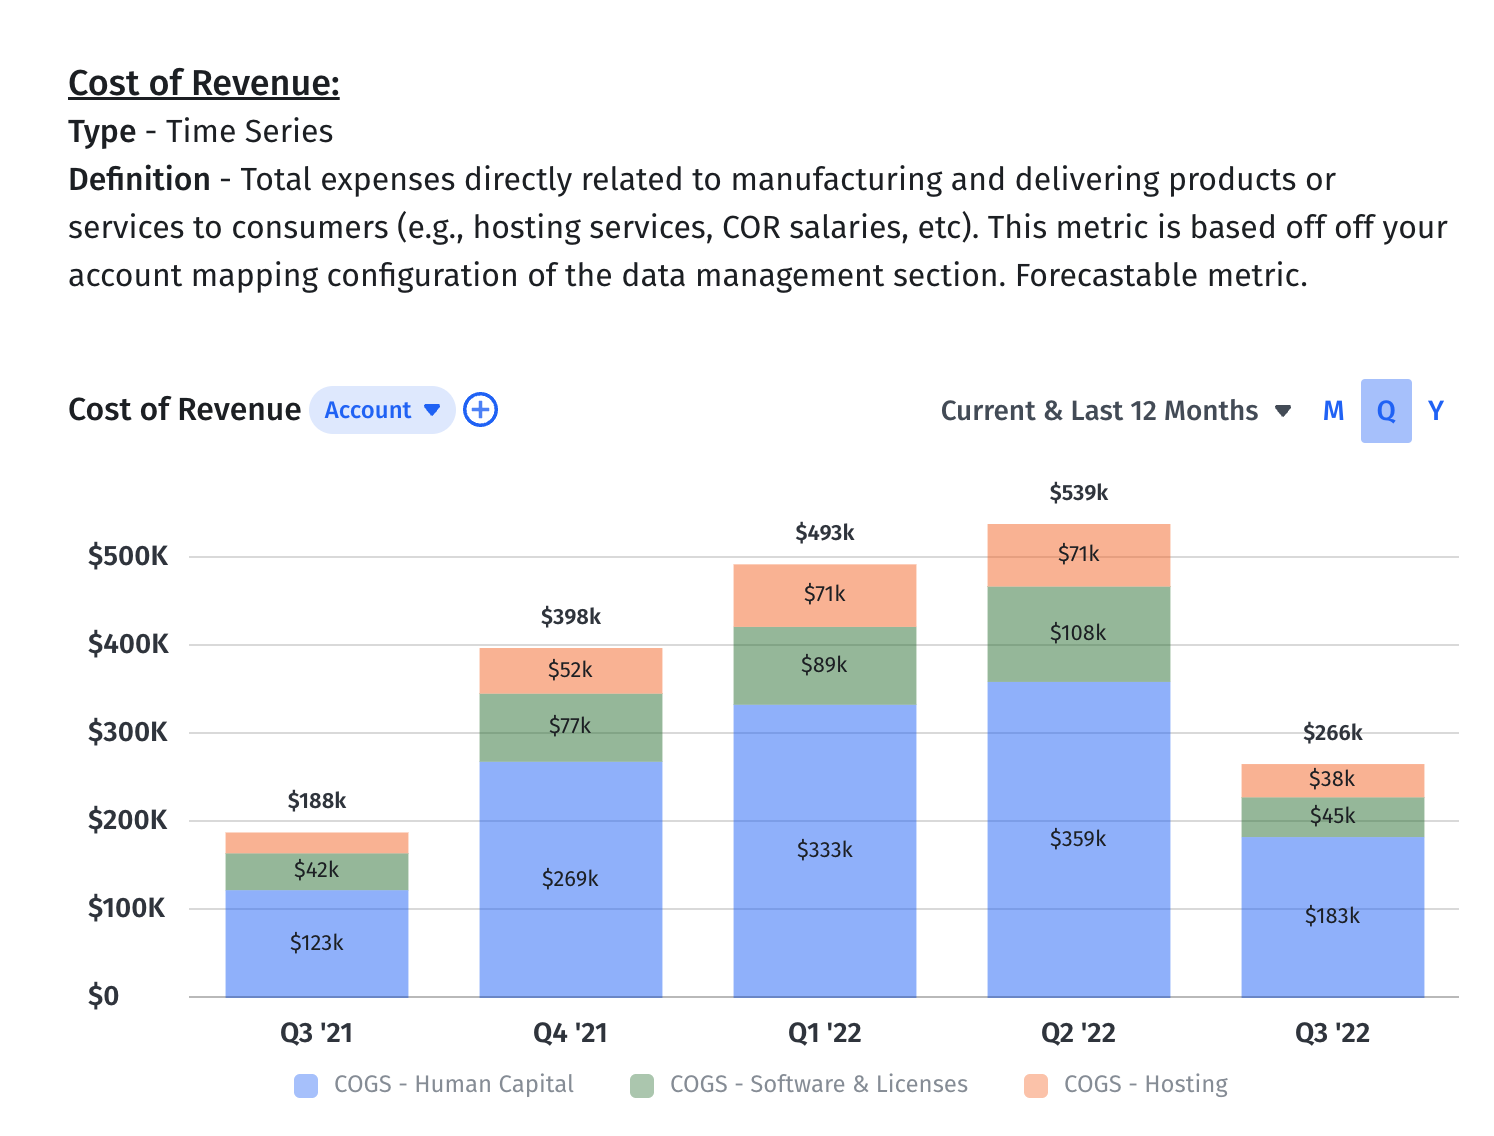
The cost of revenue refers to the costs the company incurs to offer its product or services. For instance, a SaaS company may have the following expenses included under the cost of revenue:
- Hosting infrastructure
- Cloud services like Amazon EC2
- Application performance monitoring (APM)
- Infrastructure monitoring and security
- Software licenses directly supporting the development
- Support employees
2. Operating Expenses
Operating expenses (OpEx) are ongoing expenses required to keep your business running. You’ll see operating expenses on the income statement broken out by department.
Headcount accounts for 70% of operating expenses for a SaaS company. General and administrative expenses, then, need to be as stable as possible. If you see the number increasing too quickly, you’ll want to prompt your HR leaders to investigate why. Perhaps hiring for a position is taking longer than expected, which requires more time from a freelance recruiter, or a utility company raised its costs. It’s best to keep these expenses as low as possible without disrupting your day-to-day activities.
And while investing heavily in R&D and product development can significantly reduce your profits in the short term, doing so helps you generate profits in the long run. This thinking also parallels the company’s sales and marketing efforts. While sales and marketing will be an initial expense, as long as your sales and marketing campaigns generate a positive return on investment (ROI), the company can pave its way to sustainable growth.
Still, monitoring these operating expenses is critical since they often significantly impact your profitability.
Salesforce had a higher gross profit in the first quarter of 2022 than in the first quarter of 2021, but it had a lower Q1 net profit in 2022 than in 2021. The difference? Its operating expenses.
Higher operating expenses in the first quarter of 2022 prevented Salesforce from generating higher net profit.
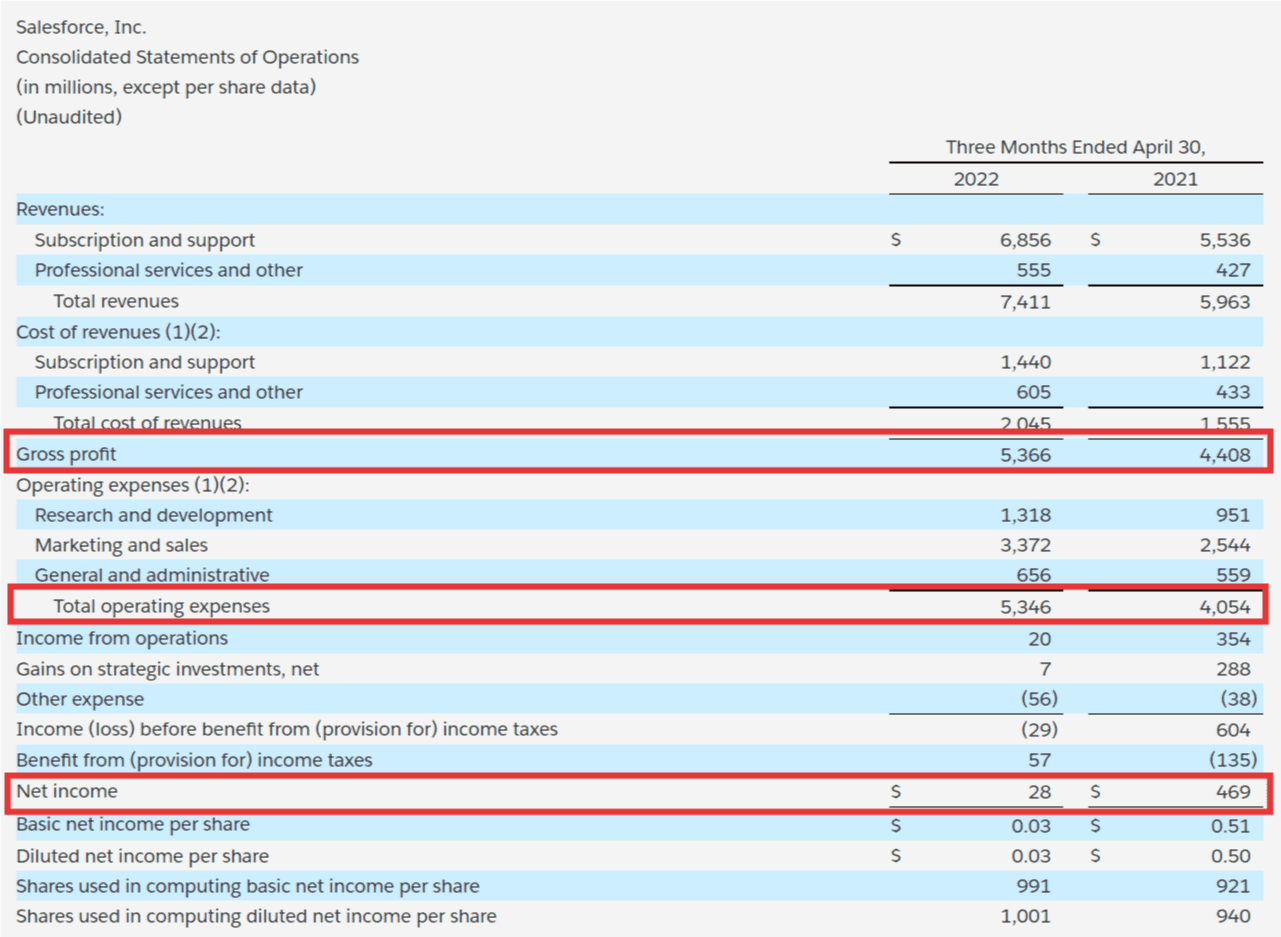
Salesforce operating expenses. Image sourced from Salesforce.
3. Expenses as Percentage of Revenue
As an operational efficiency metric, your expenses as a percentage of revenue helps you understand spend across the company. You can identify how those costs are increasing or decreasing over time. It lets you act quickly if any of your expenses exceed the acceptable limit.
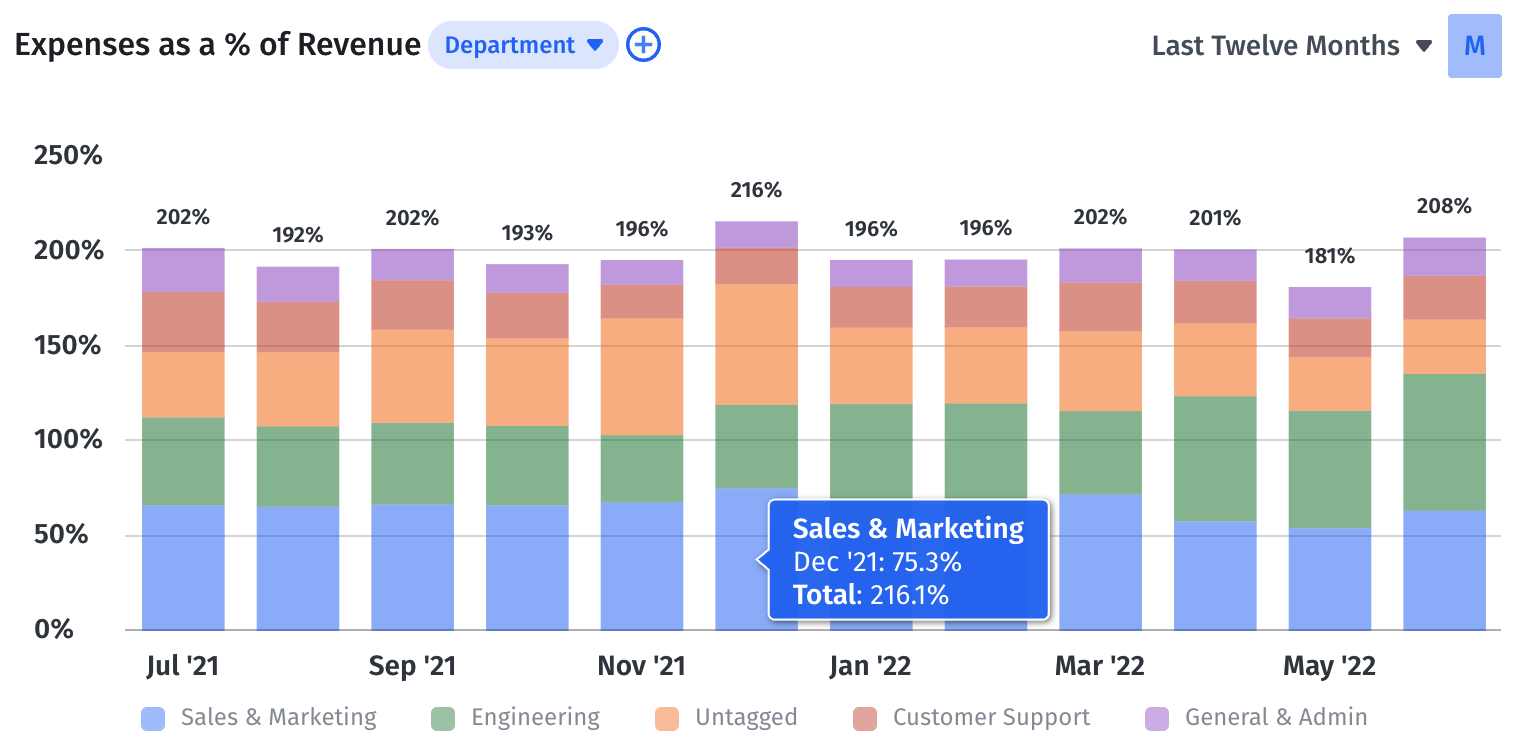
Tracking expenses as a percentage of revenue helps you track the efficiency of your business operations. You can also use this cost-revenue ratio to compare your company to industry standards.
To calculate expenses as a percentage of revenue per department, take the department’s total spend in a particular area, divide it by revenue in a given period of time, and multiply the result by 100. A high-growth company with negative net income will have total expenses over 100%.
4. Expense Composition
Expense composition is the ratio of a given expense category to the total expenses. It provides an overview of how your expense structure has changed over the past few months, quarters, or years.
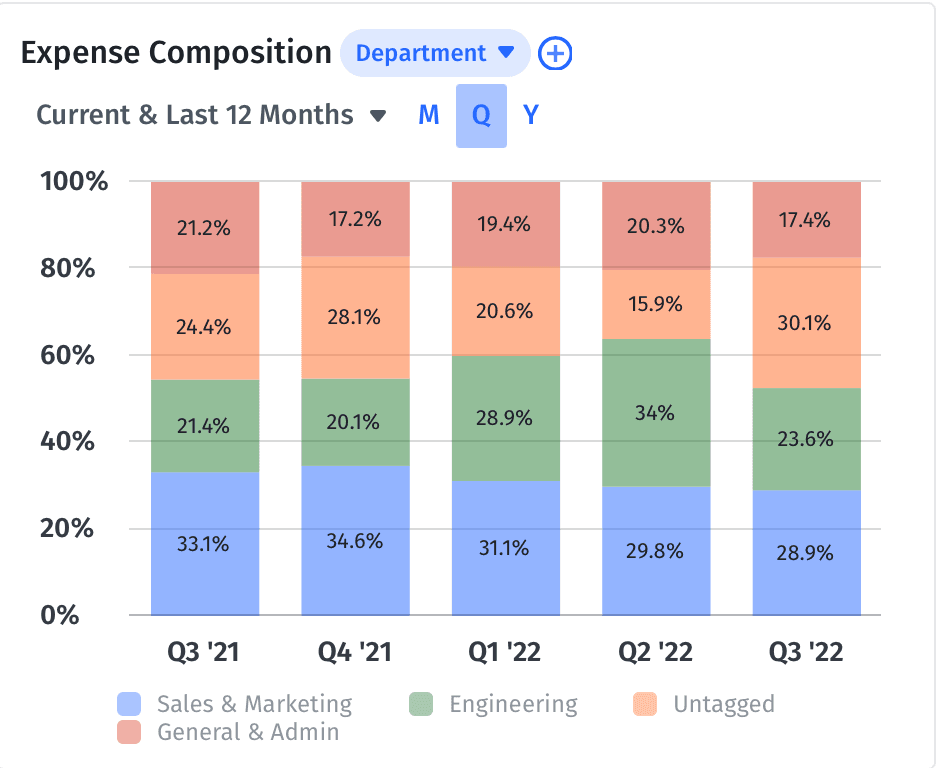
It can work as a defense mechanism for cost overruns. If you see any expense category ballooning up over time, investigate it immediately. If what you’re spending extra money on isn’t making a case for itself by generating extra income, you can prompt business partners to consider where to trim additional expenses to improve profitability and overall financial efficiency.
For example, suppose your sales and marketing expense has increased from 30% to 50%. In that case, you should verify that the campaigns are still ROI positive. It may prompt the marketing team to consider stopping or pivoting certain strategies and apply actionable insights to future campaigns.
5. Expense Changes
Expense changes measure how much an expense has increased or decreased period over period. While visualizing expense composition is helpful, you can rely on an expense changes list for more granular details.
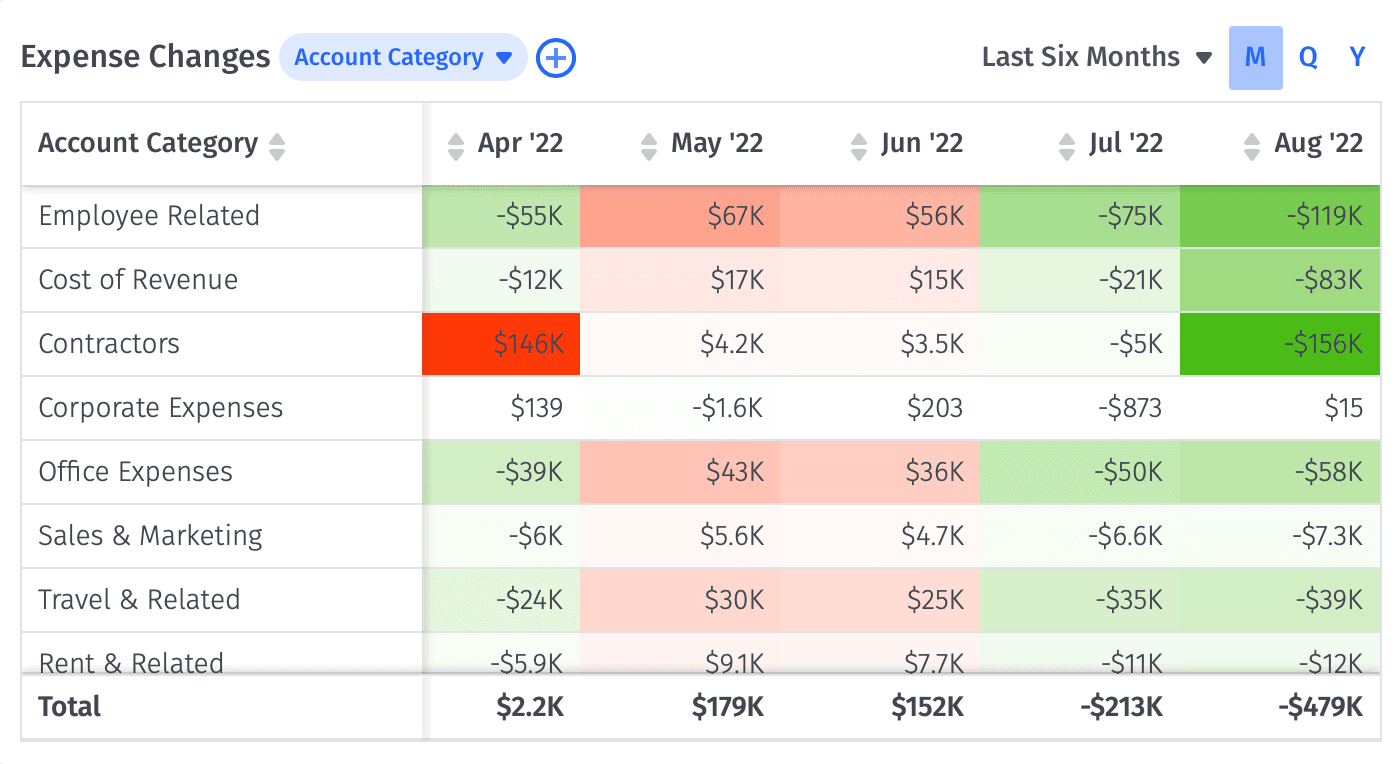
You can customize your expense changes table to filter for specific categories, as well as segment data by month, quarter, or year.
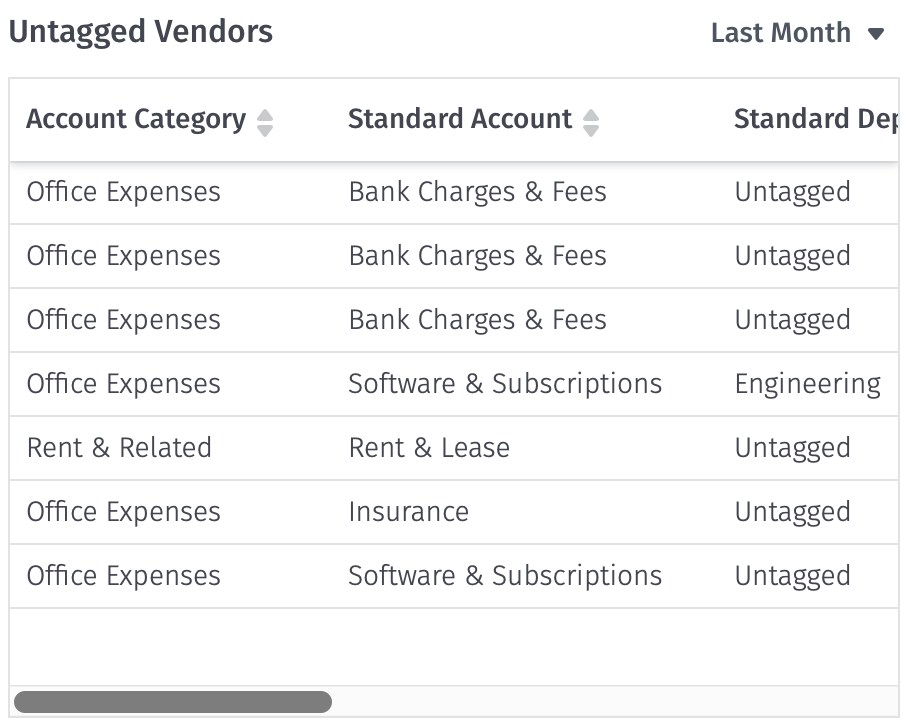
6. Untagged Expenses
Untagged expenses are expenses that haven’t been assigned to a specific vendor in your ERP. When analyzing expense reports by category, untagged expenses can remain in a silo.
Missing important data points can give you a skewed idea of your company’s expenses. An expense dashboard allows you to create an “untagged vendors” list that will gather untagged expenses to ensure that they are properly categorized and accounted for.
7. Acquisition Spend
Acquisition spend is the total amount you spend on acquiring new customers over a specific period of time. It differs from customer acquisition cost (CAC) as CAC refers to the acquisition cost per individual customer.
Acquiring new customers is typically done through the sales and marketing teams’ efforts. But tracking acquisition spend allows you to dive deeper into what acquisition channels are worth the price and which ones these teams need to reconsider.
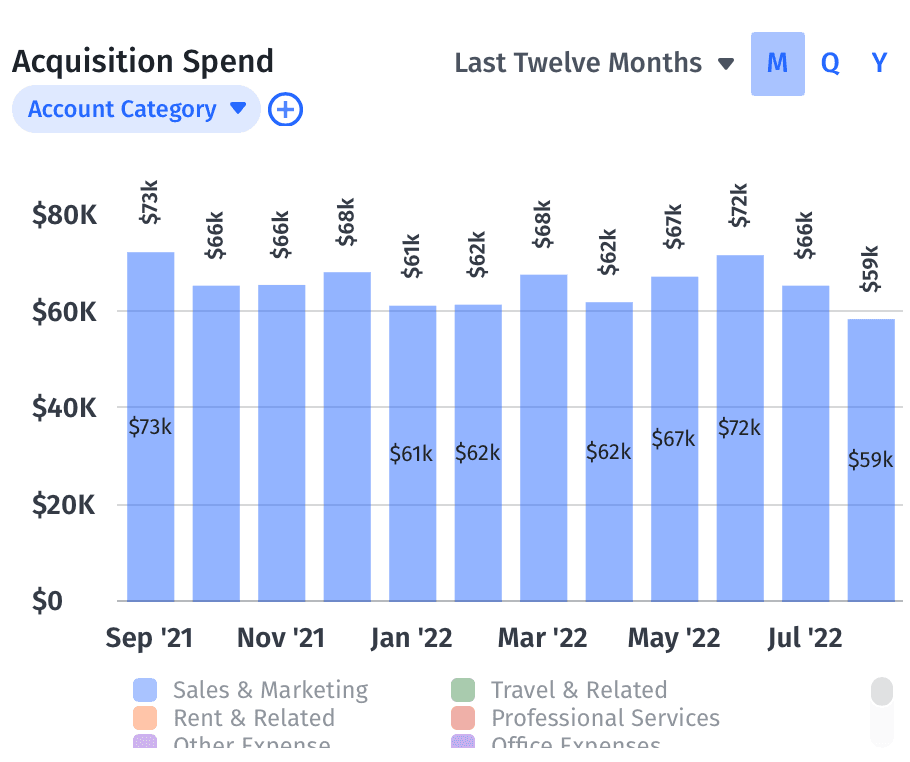
You can filter the data per month, quarter, or year to identify trends in terms of spend, and prompt marketing and sales to consider where they can spend efficiently to achieve their goals.
How to Choose an Expense Dashboard
An expense tracker dashboard shouldn’t just centralize data sources and provide visuals. You need a robust tool that:
- Shows expense data contextually so you can provide strategic insights to lead toward more impactful decisions.
- Offers customization so you can filter expense data to analyze it.
- Provides finance automation for source system integrations to calculate and visualize real-time data.
Mosaic offers an expense tracking dashboard that checks all these boxes. It lets you drill down from high-level data to granular details for monthly, quarterly, or annual expenses. You can also customize the dashboard design, so the dashboard shows expense data by account category.
Mosaic provides preloaded templates that arrange your data in visual charts or detailed tables. You can filter each visualization by categories and subcategories. For instance, you can break down employee-related expenses into overall department or individual salaries, bonuses, benefits, and more.
Track & Forecast Expenses with Granular, Real-Time Data
Other Relevant Reports Typically Used Along with an Expense Dashboard
Mosaic offers several templates and dashboards that allow you to pair your expense data with other metrics to provide a holistic picture of the company’s financials. You can use the templates as they are and adjust their visualizations, or create a custom report that captures the metrics that matter to your business partners.
Here are some financial dashboard examples you’ll find in Mosaic that are in conversation with an expense dashboard:
- Executive dashboard: A dashboard for C-suite executives, investors, and board members to get a high-level understanding of the business’s financial health.
- Forecast vs. actuals: This dashboard helps you compare forecasted figures with actuals (such as forecasted and actual expenses), enabling you to analyze your budget vs. actuals.
- Cash flow analysis: Your cash flow analysis provides an overview of cash inflows and outflows, key metrics like net burn and runway, cash flow statements, and more.
Mosaic is one expense that pays back in operational efficiency by saving you hours from tracking down expenses so you can spend more time analyzing your data and providing strategic insights for better decision-making. Request a demo today, and ask to see how Mosaic’s expense dashboard and other dashboards can lead to stronger financial strategy and collaboration across the organization.
Expense Dashboard FAQs
Can an expense dashboard help improve communication between finance teams and other departments?
Yes, an expense dashboard can significantly enhance interdepartmental communication. By visualizing expenses, it allows all stakeholders to understand the numbers more clearly and engage in more informed discussions. It can serve as a common language, bridging the gap between financial and non-financial team members.
How does an expense dashboard aid in cost management during economic downturns?
What additional features should I look for in an expense dashboard to ensure it suits my business needs?
Explore Related Metrics
Own the of your business.


